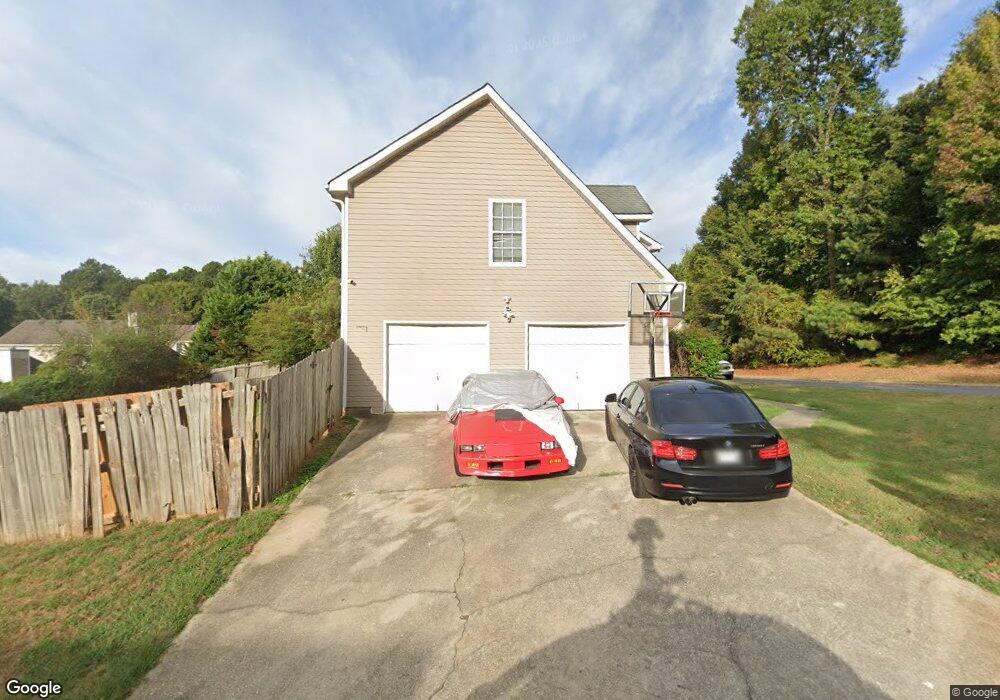
2562 Rambling Way Lithonia, GA 30058
Estimated Value: $255,475 - $328,000
4
Beds
3
Baths
2,293
Sq Ft
$125/Sq Ft
Est. Value
About This Home
This home is located at 2562 Rambling Way, Lithonia, GA 30058 and is currently estimated at $287,119, approximately $125 per square foot. 2562 Rambling Way is a home located in DeKalb County with nearby schools including Stoneview Elementary School, Lithonia Middle School, and Lithonia High School.
Ownership History
Date
Name
Owned For
Owner Type
Purchase Details
Closed on
Jan 25, 2012
Sold by
Allied Property Grp Llc
Bought by
Standard Holdings Llc
Current Estimated Value
Purchase Details
Closed on
Mar 15, 2011
Sold by
Federal Natl Mtg Assn Fnma
Bought by
Howell Terry L
Purchase Details
Closed on
Aug 3, 2010
Sold by
Chase Hm Fin Llc
Bought by
Federal Natl Mtg Assn Fnma
Purchase Details
Closed on
Jun 28, 2006
Sold by
Dehaney Wayne
Bought by
Campbell Errol D
Home Financials for this Owner
Home Financials are based on the most recent Mortgage that was taken out on this home.
Original Mortgage
$29,980
Interest Rate
6.6%
Mortgage Type
Stand Alone Refi Refinance Of Original Loan
Purchase Details
Closed on
Aug 7, 2001
Sold by
Global Residential Inc
Bought by
Dehaney Wayne
Home Financials for this Owner
Home Financials are based on the most recent Mortgage that was taken out on this home.
Original Mortgage
$139,950
Interest Rate
7.19%
Mortgage Type
VA
Create a Home Valuation Report for This Property
The Home Valuation Report is an in-depth analysis detailing your home's value as well as a comparison with similar homes in the area
Home Values in the Area
Average Home Value in this Area
Purchase History
| Date | Buyer | Sale Price | Title Company |
|---|---|---|---|
| Standard Holdings Llc | -- | -- | |
| Allied Property Grp Llc | $25,000 | -- | |
| Howell Terry L | -- | -- | |
| Federal Natl Mtg Assn Fnma | -- | -- | |
| Chase Hm Fin Llc | $140,599 | -- | |
| Campbell Errol D | $149,900 | -- | |
| Dehaney Wayne | $135,900 | -- |
Source: Public Records
Mortgage History
| Date | Status | Borrower | Loan Amount |
|---|---|---|---|
| Previous Owner | Campbell Errol D | $29,980 | |
| Previous Owner | Dehaney Wayne | $139,950 |
Source: Public Records
Tax History Compared to Growth
Tax History
| Year | Tax Paid | Tax Assessment Tax Assessment Total Assessment is a certain percentage of the fair market value that is determined by local assessors to be the total taxable value of land and additions on the property. | Land | Improvement |
|---|---|---|---|---|
| 2025 | $5,230 | $107,520 | $17,203 | $90,317 |
| 2024 | $5,361 | $111,240 | $18,000 | $93,240 |
| 2023 | $5,361 | $68,400 | $8,000 | $60,400 |
| 2022 | $3,319 | $68,400 | $8,000 | $60,400 |
| 2021 | $2,455 | $72,960 | $8,000 | $64,960 |
| 2020 | $2,434 | $48,000 | $8,000 | $40,000 |
| 2019 | $2,852 | $57,840 | $8,000 | $49,840 |
| 2018 | $1,812 | $55,080 | $8,000 | $47,080 |
| 2017 | $2,011 | $38,508 | $4,621 | $33,887 |
| 2016 | $2,015 | $38,508 | $4,621 | $33,887 |
| 2014 | $1,665 | $35,120 | $4,200 | $30,920 |
Source: Public Records
Map
Nearby Homes
- 2520 Rambling Way
- 6384 Stonebridge Creek Ln
- 6372 Stonebridge Creek Ln
- 6410 Kennonbriar Ct
- 6396 Kennonbriar Ct
- 6394 Kennonbriar Ct
- 6304 Kendra Ln
- 6457 Wellington Chase Ct
- 6565 Shaffers Way
- 6518 Wellington Chase Ct
- 2390 Camden Oak Way
- 3034 Stonebridge Creek Dr
- 6542 Wellington Chase Ct
- 6342 Kinsland Ct
- 6550 Wellington Chase Ct Unit 6550
- 2338 Rambling Way
- 6317 Creekford Ln
- 2556 Rambling Way
- 6642 Shaffers Way
- 6511 Brenda Ann Dr Unit 1
- 2561 Rambling Way
- 2567 Rambling Way Unit 2
- 2555 Rambling Way
- 2573 Rambling Way
- 6638 Shaffers Way Unit 1
- 6505 Brenda Ann Dr Unit 1
- 2549 Rambling Way Unit 2
- 2579 Rambling Way Unit 2
- 6634 Shaffers Way
- 3111 Stonebridge Creek Dr Unit 2
- 2544 Rambling Way
- 3105 Stonebridge Creek Dr Unit 2
- 3099 Stonebridge Creek Dr
- 2585 Rambling Way
- 6637 Shaffers Way Unit 1
- 0 Abbot Ln Unit 7218796
- 0 Abbot Ln Unit 8078056