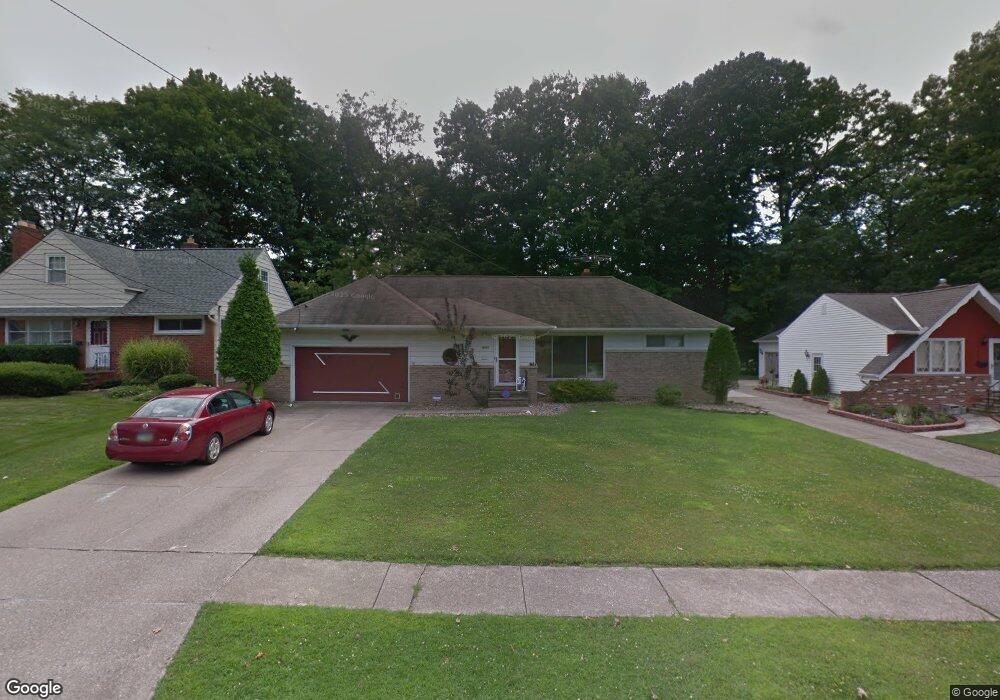
25626 Brookdale Ln Euclid, OH 44117
Estimated Value: $162,000 - $201,000
2
Beds
2
Baths
1,267
Sq Ft
$148/Sq Ft
Est. Value
About This Home
This home is located at 25626 Brookdale Ln, Euclid, OH 44117 and is currently estimated at $187,264, approximately $147 per square foot. 25626 Brookdale Ln is a home located in Cuyahoga County with nearby schools including Thomas Jefferson Elementary School, Euclid Middle School, and Euclid High School.
Ownership History
Date
Name
Owned For
Owner Type
Purchase Details
Closed on
May 16, 2006
Sold by
Newland John R and Newland Mickie G
Bought by
Newland John R and Newland Mickie G
Current Estimated Value
Purchase Details
Closed on
May 29, 2001
Sold by
Hanslik John P
Bought by
Newland John R
Home Financials for this Owner
Home Financials are based on the most recent Mortgage that was taken out on this home.
Original Mortgage
$100,000
Outstanding Balance
$38,008
Interest Rate
7.11%
Estimated Equity
$149,256
Purchase Details
Closed on
Aug 7, 1998
Sold by
Brunkus Loretta
Bought by
Hanslik John P
Home Financials for this Owner
Home Financials are based on the most recent Mortgage that was taken out on this home.
Original Mortgage
$79,500
Interest Rate
7.05%
Purchase Details
Closed on
Nov 27, 1984
Sold by
Brinkley Christine
Bought by
Brinkley Christine-Trustee
Purchase Details
Closed on
Jan 1, 1975
Bought by
Brinkley Christine
Create a Home Valuation Report for This Property
The Home Valuation Report is an in-depth analysis detailing your home's value as well as a comparison with similar homes in the area
Home Values in the Area
Average Home Value in this Area
Purchase History
| Date | Buyer | Sale Price | Title Company |
|---|---|---|---|
| Newland John R | -- | None Available | |
| Newland John R | $114,000 | Midland Title Security Inc | |
| Hanslik John P | $106,000 | Prospect Title Agency Inc | |
| Brinkley Christine-Trustee | -- | -- | |
| Brinkley Christine | -- | -- |
Source: Public Records
Mortgage History
| Date | Status | Borrower | Loan Amount |
|---|---|---|---|
| Open | Newland John R | $100,000 | |
| Previous Owner | Hanslik John P | $79,500 | |
| Closed | Hanslik John P | $15,900 |
Source: Public Records
Tax History Compared to Growth
Tax History
| Year | Tax Paid | Tax Assessment Tax Assessment Total Assessment is a certain percentage of the fair market value that is determined by local assessors to be the total taxable value of land and additions on the property. | Land | Improvement |
|---|---|---|---|---|
| 2024 | $3,960 | $58,065 | $12,460 | $45,605 |
| 2023 | $3,279 | $38,120 | $9,700 | $28,420 |
| 2022 | $3,204 | $38,120 | $9,700 | $28,420 |
| 2021 | $3,571 | $38,120 | $9,700 | $28,420 |
| 2020 | $3,386 | $32,870 | $8,370 | $24,500 |
| 2019 | $3,046 | $93,900 | $23,900 | $70,000 |
| 2018 | $3,089 | $32,870 | $8,370 | $24,500 |
| 2017 | $3,364 | $30,070 | $6,720 | $23,350 |
| 2016 | $3,371 | $30,070 | $6,720 | $23,350 |
| 2015 | $3,067 | $30,070 | $6,720 | $23,350 |
| 2014 | $3,067 | $30,070 | $6,720 | $23,350 |
Source: Public Records
Map
Nearby Homes
- 25321 Chatworth Dr
- 1836 Braeburn Park Dr
- 24691 Hawthorne Dr
- 1823 Sunset Dr
- 24971 Euclid Ave
- 1790 Skyline Dr
- 25151 Euclid Ave
- 1865 Idlehurst Dr
- 1851 Beverly Hills Dr
- 164 Richmond Rd
- 1864 Glen Oval
- 1552 E 254th St
- 1468 E 252nd St
- 145 Richmond Rd
- 1467 E 250th St
- 1498 E 248th St
- 1530 E 254th St
- 1620 E 243rd St
- 1474 E 248th St
- 1523 Babbitt Rd
- 25630 Brookdale Ln
- 25622 Brookdale Ln
- 25636 Brookdale Ln
- 25627 Breckenridge Dr
- 25631 Breckenridge Dr
- 25635 Breckenridge Dr
- 25623 Breckenridge Dr
- 25640 Brookdale Ln
- 25614 Brookdale Ln
- 25629 Brookdale Ln
- 25625 Brookdale Ln
- 25617 Brookdale Ln
- 25633 Brookdale Ln
- 25641 Breckenridge Dr
- 25621 Brookdale Ln
- 25644 Brookdale Ln
- 25637 Brookdale Ln
- 25641 Brookdale Ln
- 25645 Brookdale Ln
- 25636 Breckenridge Dr