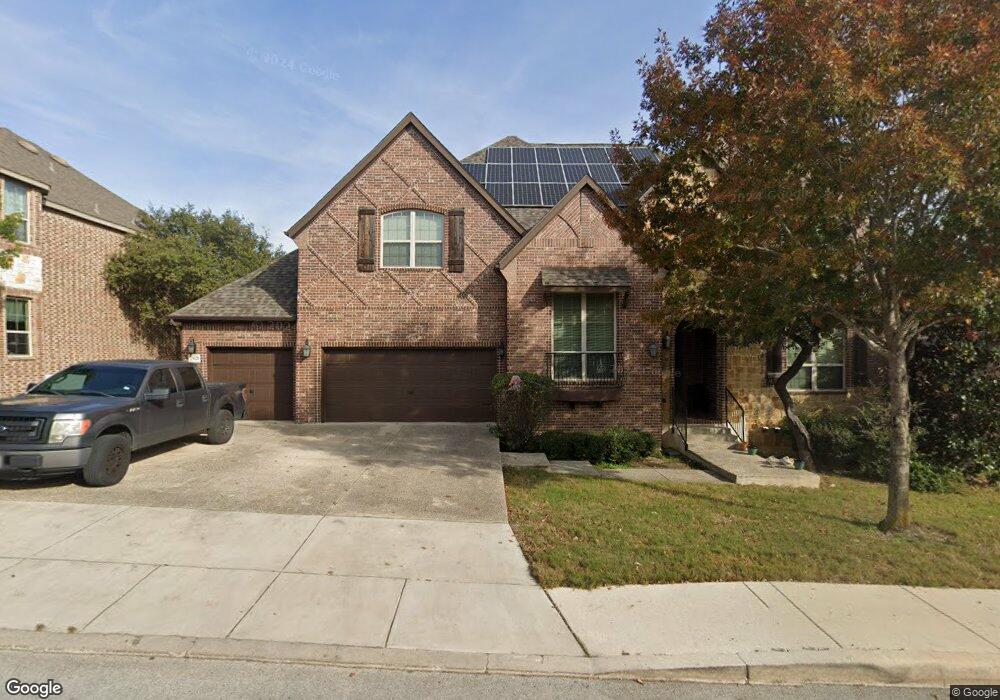
25628 Santolina San Antonio, TX 78261
Bulverde Village NeighborhoodEstimated Value: $619,000 - $743,000
5
Beds
5
Baths
4,370
Sq Ft
$153/Sq Ft
Est. Value
About This Home
This home is located at 25628 Santolina, San Antonio, TX 78261 and is currently estimated at $667,763, approximately $152 per square foot. 25628 Santolina is a home located in Bexar County with nearby schools including Indian Springs Elementary School.
Ownership History
Date
Name
Owned For
Owner Type
Purchase Details
Closed on
Sep 23, 2013
Sold by
Reed Audwin W and Reed Jennifer E
Bought by
Mcclellan Michelle A and Mcclellan Jerry R
Current Estimated Value
Home Financials for this Owner
Home Financials are based on the most recent Mortgage that was taken out on this home.
Original Mortgage
$417,000
Outstanding Balance
$311,793
Interest Rate
4.45%
Mortgage Type
VA
Estimated Equity
$355,970
Purchase Details
Closed on
Nov 28, 2012
Sold by
Megatel Homes Inc
Bought by
Reed Audwin W and Reed Jennifer E
Home Financials for this Owner
Home Financials are based on the most recent Mortgage that was taken out on this home.
Original Mortgage
$337,810
Interest Rate
3.25%
Mortgage Type
FHA
Purchase Details
Closed on
Jun 19, 2012
Sold by
Hll Land Acquisitions Of Texas Lp
Bought by
Megatel Homes Inc
Home Financials for this Owner
Home Financials are based on the most recent Mortgage that was taken out on this home.
Original Mortgage
$308,000
Interest Rate
3.83%
Mortgage Type
Construction
Create a Home Valuation Report for This Property
The Home Valuation Report is an in-depth analysis detailing your home's value as well as a comparison with similar homes in the area
Home Values in the Area
Average Home Value in this Area
Purchase History
| Date | Buyer | Sale Price | Title Company |
|---|---|---|---|
| Mcclellan Michelle A | -- | Ctot | |
| Reed Audwin W | -- | Itc | |
| Megatel Homes Inc | -- | North American Title Company |
Source: Public Records
Mortgage History
| Date | Status | Borrower | Loan Amount |
|---|---|---|---|
| Open | Mcclellan Michelle A | $417,000 | |
| Previous Owner | Reed Audwin W | $337,810 | |
| Previous Owner | Megatel Homes Inc | $308,000 |
Source: Public Records
Tax History Compared to Growth
Tax History
| Year | Tax Paid | Tax Assessment Tax Assessment Total Assessment is a certain percentage of the fair market value that is determined by local assessors to be the total taxable value of land and additions on the property. | Land | Improvement |
|---|---|---|---|---|
| 2025 | -- | $703,260 | $104,220 | $599,040 |
| 2024 | -- | $663,198 | $104,220 | $579,070 |
| 2023 | $11,433 | $602,907 | $104,220 | $620,710 |
| 2022 | $11,429 | $548,097 | $86,830 | $559,560 |
| 2021 | $10,503 | $498,270 | $75,350 | $422,920 |
| 2020 | $10,326 | $482,510 | $75,350 | $407,160 |
| 2019 | $10,725 | $490,750 | $75,350 | $415,400 |
| 2018 | $10,197 | $466,720 | $75,350 | $391,370 |
| 2017 | $9,794 | $447,770 | $75,350 | $372,420 |
| 2016 | $9,700 | $443,460 | $75,350 | $368,110 |
| 2015 | $13 | $444,270 | $55,000 | $389,270 |
| 2014 | $13 | $407,770 | $0 | $0 |
Source: Public Records
Map
Nearby Homes
- 3718 Pinyon Pine
- 25703 Berberis
- 25706 Coreopsis
- 25714 Berberis
- 3843 Ox-Eye Daisy
- 25815 Plumbago
- 3818 Sweet Olive
- 25819 Berberis
- 25707 Preserve Crest
- 25346 Colt River
- 3722 Sweet Olive
- 25615 Coral Vine
- 25268 Cambridge Well
- 5219 Wolf Bane Dr
- 3702 Sweet Olive
- 3707 Eliberis
- 3618 Sweet Olive
- 25214 Judson Bend
- 25514 Thomas Oaks
- 3719 Forsythia
- 25620 Santolina
- 25636 Santolina
- 25627 Rabbitbrush
- 25631 Rabbitbrush
- 25627 Santolina
- 25635 Santolina
- 25619 Santolina
- 25644 Santolina
- 25619 Rabbitbrush
- 25643 Santolina
- 25639 Rabbitbrush
- 25611 Santolina
- 25651 Santolina
- 25626 Sago Palm
- 25630 Rabbitbrush
- 25652 Santolina
- 25630 Sago Palm
- 25622 Sago Palm
- 25634 Rabbitbrush
- 25626 Rabbitbrush