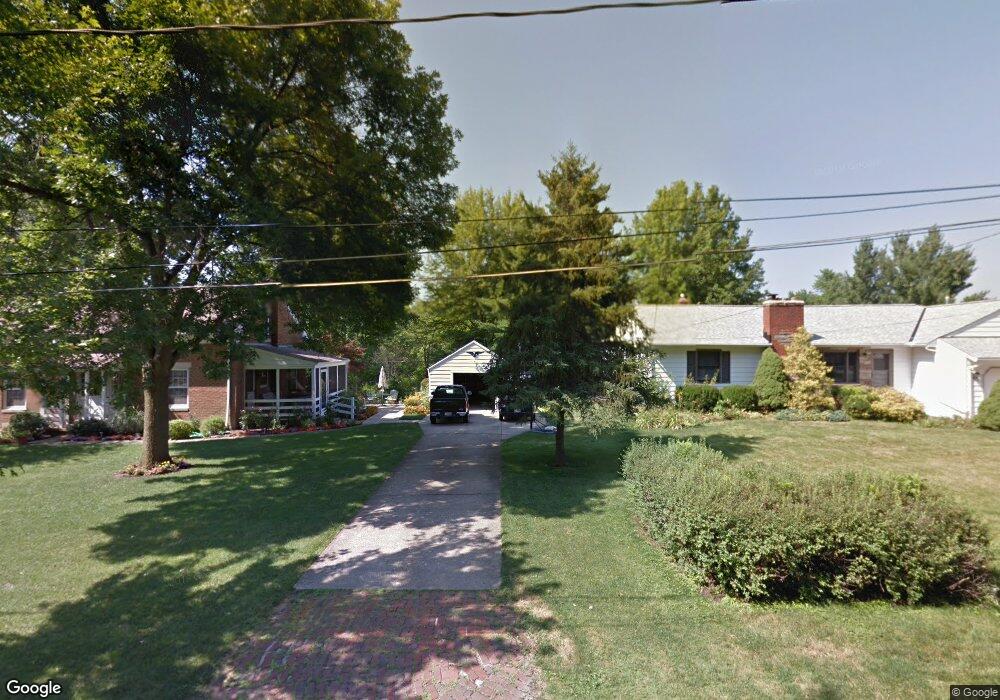
25630 Taylor St Olmsted Falls, OH 44138
Estimated Value: $257,544 - $303,000
3
Beds
1
Bath
1,697
Sq Ft
$167/Sq Ft
Est. Value
About This Home
This home is located at 25630 Taylor St, Olmsted Falls, OH 44138 and is currently estimated at $283,136, approximately $166 per square foot. 25630 Taylor St is a home located in Cuyahoga County with nearby schools including Falls-Lenox Primary Elementary School, Olmsted Falls Intermediate Building, and Olmsted Falls Middle School.
Ownership History
Date
Name
Owned For
Owner Type
Purchase Details
Closed on
Oct 14, 2020
Sold by
Estate Of Michael C Radigan
Bought by
Radigan Laura J
Current Estimated Value
Purchase Details
Closed on
Aug 30, 2004
Sold by
Miska Richard and Miska William
Bought by
Radigan Michael C and Radigan Laura J
Home Financials for this Owner
Home Financials are based on the most recent Mortgage that was taken out on this home.
Original Mortgage
$75,000
Outstanding Balance
$37,652
Interest Rate
6.08%
Mortgage Type
Purchase Money Mortgage
Estimated Equity
$245,484
Purchase Details
Closed on
Jun 13, 1990
Sold by
Miska Richard
Bought by
Miska Richard
Purchase Details
Closed on
Apr 26, 1990
Sold by
Miska Stella
Bought by
Miska Richard
Purchase Details
Closed on
Mar 21, 1979
Sold by
Miska Joseph and Miska Stella S
Bought by
Miska Stella
Purchase Details
Closed on
Jan 1, 1975
Bought by
Miska Joseph and Miska Stella S
Create a Home Valuation Report for This Property
The Home Valuation Report is an in-depth analysis detailing your home's value as well as a comparison with similar homes in the area
Home Values in the Area
Average Home Value in this Area
Purchase History
| Date | Buyer | Sale Price | Title Company |
|---|---|---|---|
| Radigan Laura J | -- | None Available | |
| Radigan Michael C | $145,000 | Executive Title Agency | |
| Miska Richard | -- | -- | |
| Miska Richard | -- | -- | |
| Miska Stella | -- | -- | |
| Miska Joseph | -- | -- |
Source: Public Records
Mortgage History
| Date | Status | Borrower | Loan Amount |
|---|---|---|---|
| Open | Radigan Michael C | $75,000 |
Source: Public Records
Tax History Compared to Growth
Tax History
| Year | Tax Paid | Tax Assessment Tax Assessment Total Assessment is a certain percentage of the fair market value that is determined by local assessors to be the total taxable value of land and additions on the property. | Land | Improvement |
|---|---|---|---|---|
| 2024 | $5,233 | $79,800 | $13,930 | $65,870 |
| 2023 | $5,024 | $62,870 | $13,060 | $49,810 |
| 2022 | $4,979 | $62,860 | $13,060 | $49,810 |
| 2021 | $4,930 | $62,860 | $13,060 | $49,810 |
| 2020 | $4,456 | $50,260 | $10,430 | $39,830 |
| 2019 | $3,956 | $143,600 | $29,800 | $113,800 |
| 2018 | $4,052 | $50,260 | $10,430 | $39,830 |
| 2017 | $4,127 | $48,620 | $10,330 | $38,290 |
| 2016 | $4,105 | $48,620 | $10,330 | $38,290 |
| 2015 | $3,906 | $48,620 | $10,330 | $38,290 |
| 2014 | $3,906 | $45,020 | $9,560 | $35,460 |
Source: Public Records
Map
Nearby Homes
- 0
- 8241 Lewis Rd
- V/L Columbia Rd
- Anderson Plan at Smokestack Trails
- Bramante Ranch Plan at Smokestack Trails
- Hudson Plan at Smokestack Trails
- Columbia Plan at Smokestack Trails
- Lehigh Plan at Smokestack Trails
- 26535 Bayfair Dr
- 7593 Columbia Rd
- 281-12-024 River Rd
- 281-12-007 River Rd
- 25725 Cook Rd
- 26685 Cranage Rd
- Caroline Plan at Falls Landing - Villas
- Wexford Plan at Falls Landing - Villas
- Rosecliff Plan at Falls Landing - Villas
- 260 Stone Ridge Way
- 136 River Rock Way Unit D
- 29 Carl Ln
- 25610 Taylor St
- 25660 Taylor St
- 25615 Bagley Rd
- 25607 Taylor St
- 25615 Taylor St
- 25615 Taylor Rd
- 25645 Taylor St
- 25700 Taylor St
- 25731 Bagley Rd
- 25601 Taylor St
- 25751 Bagley Rd
- 25695 Taylor St
- 25695 Taylor St
- 25695 Taylor St
- 25695 Taylor St
- 25695 Taylor St
- 8229 Usher Rd
- 25660 Bagley Rd
- 8301 Usher Rd
- 8370 Columbia Rd