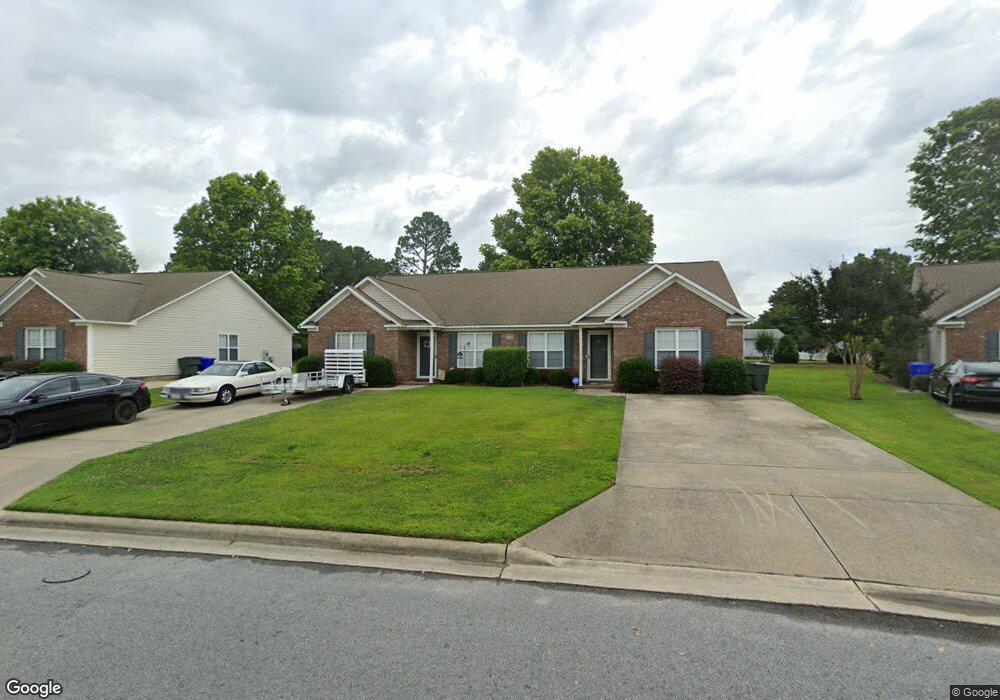
2564 Saddleback Dr Winterville, NC 28590
Estimated Value: $193,638 - $198,000
Studio
--
Bath
1,282
Sq Ft
$153/Sq Ft
Est. Value
About This Home
This home is located at 2564 Saddleback Dr, Winterville, NC 28590 and is currently estimated at $195,660, approximately $152 per square foot. 2564 Saddleback Dr is a home located in Pitt County with nearby schools including Creekside Elementary School, A.G. Cox Middle School, and South Central High School.
Ownership History
Date
Name
Owned For
Owner Type
Purchase Details
Closed on
Apr 13, 2024
Sold by
Campbell Marquitia A and Wiggins Marquitia C
Bought by
Williams Clinton E and Williams Peggy L
Current Estimated Value
Purchase Details
Closed on
Oct 23, 2007
Sold by
Nelson William D and West Erin L
Bought by
Campbell Marquitia A
Home Financials for this Owner
Home Financials are based on the most recent Mortgage that was taken out on this home.
Original Mortgage
$100,500
Interest Rate
6.26%
Mortgage Type
New Conventional
Purchase Details
Closed on
Oct 31, 2006
Sold by
Rocky Russell Builders Inc
Bought by
Nelson William D and West Erin L
Home Financials for this Owner
Home Financials are based on the most recent Mortgage that was taken out on this home.
Original Mortgage
$106,500
Interest Rate
6.25%
Mortgage Type
New Conventional
Create a Home Valuation Report for This Property
The Home Valuation Report is an in-depth analysis detailing your home's value as well as a comparison with similar homes in the area
Home Values in the Area
Average Home Value in this Area
Purchase History
| Date | Buyer | Sale Price | Title Company |
|---|---|---|---|
| Williams Clinton E | $207,000 | None Listed On Document | |
| Campbell Marquitia A | $106,500 | None Available | |
| Nelson William D | $106,500 | None Available |
Source: Public Records
Mortgage History
| Date | Status | Borrower | Loan Amount |
|---|---|---|---|
| Previous Owner | Campbell Marquitia A | $100,500 | |
| Previous Owner | Nelson William D | $106,500 |
Source: Public Records
Tax History
| Year | Tax Paid | Tax Assessment Tax Assessment Total Assessment is a certain percentage of the fair market value that is determined by local assessors to be the total taxable value of land and additions on the property. | Land | Improvement |
|---|---|---|---|---|
| 2025 | $1,802 | $172,406 | $30,000 | $142,406 |
| 2024 | $1,790 | $172,406 | $30,000 | $142,406 |
| 2023 | $1,404 | $110,611 | $15,000 | $95,611 |
| 2022 | $1,418 | $110,611 | $15,000 | $95,611 |
| 2021 | $1,404 | $110,611 | $15,000 | $95,611 |
| 2020 | $1,414 | $110,611 | $15,000 | $95,611 |
| 2019 | $1,272 | $95,777 | $15,000 | $80,777 |
| 2018 | $1,236 | $95,777 | $15,000 | $80,777 |
| 2017 | $1,236 | $95,777 | $15,000 | $80,777 |
| 2016 | $1,309 | $95,777 | $15,000 | $80,777 |
| 2015 | $1,309 | $103,154 | $19,500 | $83,654 |
| 2014 | $1,309 | $103,154 | $19,500 | $83,654 |
Source: Public Records
Map
Nearby Homes
- 2552 Saddleback Dr Unit A
- 2644 Rhinestone Dr
- 2320 Saddleback Dr Unit B
- 820 Emerald Park Dr
- 2601 Rhinestone Dr
- 3404 Saybrook Ct
- 825 Jade Ln
- 2324 Rhinestone Dr
- 2346 Rhinestone Dr
- 567 Ridge Dr
- 2201 Zircon Dr
- 2340 Rhinestone Dr
- 2336 Rhinestone Dr
- 2328 Rhinestone Dr
- 2324 Rhrinestone Dr
- 2341 Rhinestone Dr
- 2333 Rhinestone Dr
- 2329 Rhinestone Dr
- 2325 Rhinestone Dr
- 2321 Rhinestone Dr
- 2564 Saddleback Dr
- 2564 Saddleback Dr Unit A
- 2564 Saddleback Dr Unit B
- 2560 Saddleback Dr
- 2560 Saddleback Dr
- 2560 Saddleback Dr Unit A
- 2560 Saddleback Dr Unit B
- 2568 Saddleback Dr
- 2568 Saddleback Dr
- 2568 Saddleback Dr Unit B
- 2553 Saddleback Dr
- 2553 Saddleback Dr
- 2553 Saddleback Dr Unit B
- 2553 Saddleback Dr Unit A
- 2556A Saddleback Dr
- 2301 Sadler Dr Unit A
- 2301 Sadler Dr Unit B
- 2556 Saddleback Dr
- 2556 Saddleback Dr Unit A
- 2600 Saddleback Dr
Your Personal Tour Guide
Ask me questions while you tour the home.