Estimated Value: $596,000 - $653,000
4
Beds
2
Baths
1,900
Sq Ft
$331/Sq Ft
Est. Value
About This Home
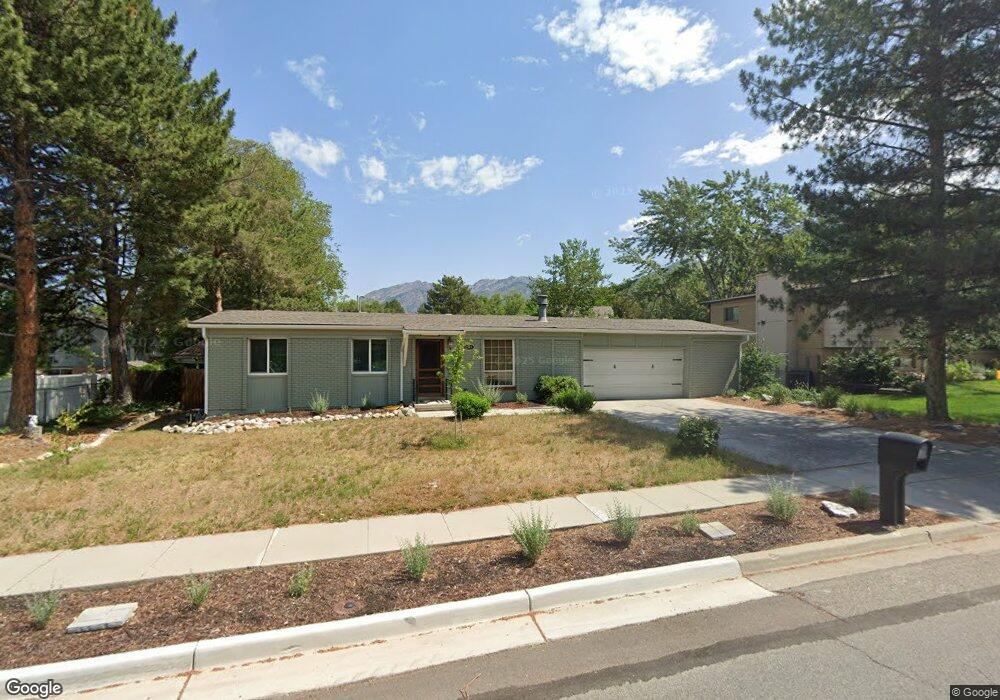
This home is located at 2565 E Woodchuck Way, Sandy, UT 84093 and is currently estimated at $629,171, approximately $331 per square foot. 2565 E Woodchuck Way is a home located in Salt Lake County with nearby schools including Quail Hollow Elementary School, Albion Middle School, and Brighton High School.
Ownership History
Date
Name
Owned For
Owner Type
Purchase Details
Closed on
Jun 20, 2024
Sold by
Mcfall Thomas
Bought by
Nakaoka Hannah Elizabeth and Nakaoka Hannah Mcfall
Current Estimated Value
Purchase Details
Closed on
Oct 17, 2020
Sold by
Nakaoka Hannah and Nakaoka Joshua
Bought by
Mcfall Thomas
Purchase Details
Closed on
Nov 20, 2019
Sold by
Mcfall Thomas
Bought by
Mcfall Michael and Rorem Nicole
Purchase Details
Closed on
Jul 26, 2019
Sold by
Geurts Brian K and Estate Of Bruce A Geurts
Bought by
Ellis Miriam
Home Financials for this Owner
Home Financials are based on the most recent Mortgage that was taken out on this home.
Original Mortgage
$292,000
Interest Rate
3.8%
Mortgage Type
Commercial
Purchase Details
Closed on
Nov 4, 1996
Sold by
Geurts Bonnie Seegmiller
Bought by
Geurts Bruce Alexander
Create a Home Valuation Report for This Property
The Home Valuation Report is an in-depth analysis detailing your home's value as well as a comparison with similar homes in the area
Home Values in the Area
Average Home Value in this Area
Purchase History
| Date | Buyer | Sale Price | Title Company |
|---|---|---|---|
| Nakaoka Hannah Elizabeth | -- | None Listed On Document | |
| Mcfall Thomas | -- | None Available | |
| Mcfall Michael | -- | Old Republic Ttl Draper Orem | |
| Mcfall Thomas | -- | Old Republic Ttl Draper Orem | |
| Ellis Miriam | -- | Artisan Title | |
| Geurts Bruce Alexander | -- | -- |
Source: Public Records
Mortgage History
| Date | Status | Borrower | Loan Amount |
|---|---|---|---|
| Previous Owner | Ellis Miriam | $292,000 |
Source: Public Records
Tax History
| Year | Tax Paid | Tax Assessment Tax Assessment Total Assessment is a certain percentage of the fair market value that is determined by local assessors to be the total taxable value of land and additions on the property. | Land | Improvement |
|---|---|---|---|---|
| 2025 | $2,972 | $561,100 | $226,800 | $334,300 |
| 2024 | $2,972 | $557,000 | $218,300 | $338,700 |
| 2023 | -- | $518,800 | $209,900 | $308,900 |
| 2022 | $0 | $525,300 | $205,800 | $319,500 |
| 2021 | $3,352 | $399,000 | $156,200 | $242,800 |
| 2020 | $2,375 | $351,200 | $156,200 | $195,000 |
| 2019 | $1,526 | $220,200 | $147,400 | $72,800 |
| 2016 | $1,381 | $178,100 | $132,800 | $45,300 |
Source: Public Records
Map
Nearby Homes
- 2547 E Falcon Way
- 9162 S Glenn Abbey Way
- 9472 Fox Hunt Dr
- 2333 Cliff Swallow Dr
- 8931 Quail Hollow Dr
- 9969 Altamont Dr
- 9623 Tannenbaum Cove
- 9078 S Daybreak Dr
- 2156 E Falcon Way
- 8916 Cobble Crest Ln
- 9650 S Buttonwood Dr
- 2197 E Thistlewood Way
- 2724 Mount Jordan Rd
- 9942 S Altamont Dr
- 8597 Mount Majestic Rd
- 8585 Mount Majestic Rd
- 2170 E Borg Ct
- 2670 Bridger Blvd Unit 8
- 8760 S Rustler Rd
- 3357 Glacier Ln
- 2565 Woodchuck Way
- 2577 Woodchuck Way
- 9333 S Peacock Dr
- 9333 Peacock Dr
- 2574 Falcon Way
- 2586 Falcon Way
- 9279 S Peacock Dr
- 9279 Peacock Dr
- 2560 E Woodchuck Way
- 2560 Woodchuck Way
- 9347 Peacock Dr
- 2589 Woodchuck Way
- 9347 S Peacock Dr
- 2589 E Woodchuck Way
- 2574 Woodchuck Way
- 2598 E Falcon Way
- 2598 Falcon Way
- 2584 Woodchuck Way
- 9294 Peacock Dr
- 2544 Falcon Way
Your Personal Tour Guide
Ask me questions while you tour the home.