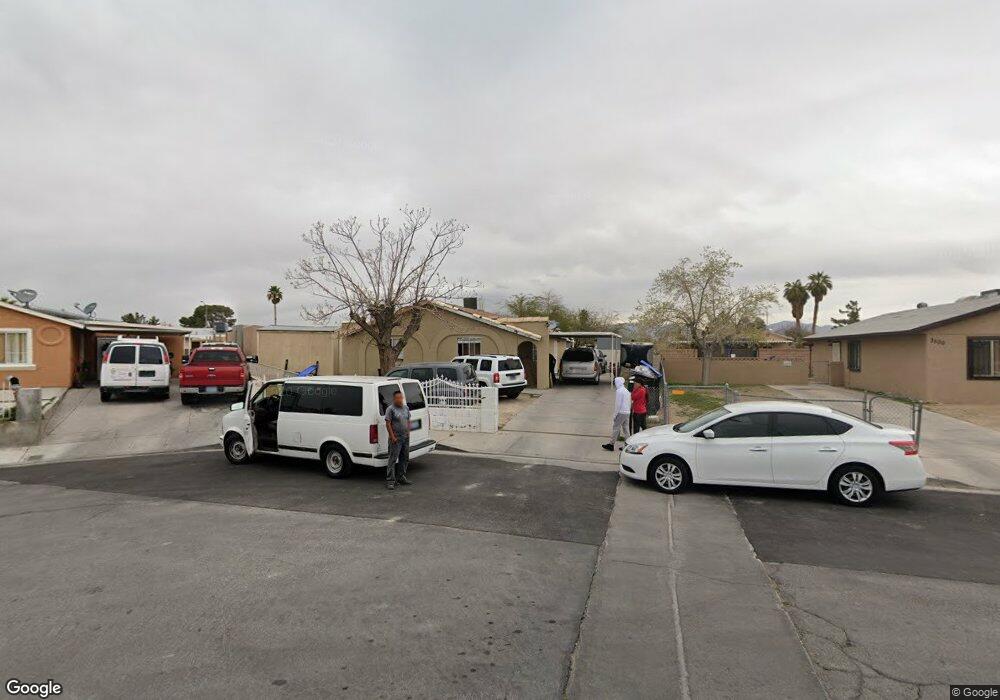
2565 Kenneth Rd North Las Vegas, NV 89030
Downtown North Las Vegas NeighborhoodEstimated Value: $320,000 - $370,000
4
Beds
2
Baths
1,200
Sq Ft
$280/Sq Ft
Est. Value
About This Home
This home is located at 2565 Kenneth Rd, North Las Vegas, NV 89030 and is currently estimated at $336,010, approximately $280 per square foot. 2565 Kenneth Rd is a home located in Clark County with nearby schools including Fay Herron Elementary School, Von Tobel Middle School, and Sunrise Mountain High School.
Ownership History
Date
Name
Owned For
Owner Type
Purchase Details
Closed on
Mar 31, 2016
Sold by
Earnest Charles V
Bought by
Scottreal Llc
Current Estimated Value
Purchase Details
Closed on
Apr 17, 2012
Sold by
Menlo Properties Llc
Bought by
Earnest Charles
Purchase Details
Closed on
May 27, 2010
Sold by
Retana Luciano and Retana Maribel
Bought by
Menlo Properties Llc
Purchase Details
Closed on
Apr 26, 2006
Sold by
Aguilera Rogelio
Bought by
Retana Luciano and Retana Maribel
Home Financials for this Owner
Home Financials are based on the most recent Mortgage that was taken out on this home.
Original Mortgage
$180,000
Interest Rate
6.5%
Mortgage Type
Unknown
Purchase Details
Closed on
Dec 28, 1993
Sold by
Puga Maria E
Bought by
Aguilera Rogelio
Home Financials for this Owner
Home Financials are based on the most recent Mortgage that was taken out on this home.
Original Mortgage
$57,266
Interest Rate
7.09%
Mortgage Type
FHA
Create a Home Valuation Report for This Property
The Home Valuation Report is an in-depth analysis detailing your home's value as well as a comparison with similar homes in the area
Home Values in the Area
Average Home Value in this Area
Purchase History
| Date | Buyer | Sale Price | Title Company |
|---|---|---|---|
| Scottreal Llc | -- | None Available | |
| Earnest Charles | $21,500 | None Available | |
| Menlo Properties Llc | $18,900 | None Available | |
| Retana Luciano | $225,000 | Equity Title Of Nevada | |
| Aguilera Rogelio | $1,000 | Land Title |
Source: Public Records
Mortgage History
| Date | Status | Borrower | Loan Amount |
|---|---|---|---|
| Previous Owner | Retana Luciano | $180,000 | |
| Previous Owner | Aguilera Rogelio | $57,266 |
Source: Public Records
Tax History Compared to Growth
Tax History
| Year | Tax Paid | Tax Assessment Tax Assessment Total Assessment is a certain percentage of the fair market value that is determined by local assessors to be the total taxable value of land and additions on the property. | Land | Improvement |
|---|---|---|---|---|
| 2025 | $802 | $43,687 | $27,195 | $16,492 |
| 2024 | $743 | $43,687 | $27,195 | $16,492 |
| 2023 | $723 | $40,683 | $26,460 | $14,223 |
| 2022 | $670 | $35,174 | $22,418 | $12,756 |
| 2021 | $621 | $30,937 | $19,110 | $11,827 |
| 2020 | $573 | $28,712 | $16,538 | $12,174 |
| 2019 | $537 | $27,878 | $15,435 | $12,443 |
| 2018 | $513 | $24,181 | $11,900 | $12,281 |
| 2017 | $781 | $23,284 | $10,500 | $12,784 |
| 2016 | $481 | $19,537 | $5,950 | $13,587 |
| 2015 | $479 | $18,659 | $4,900 | $13,759 |
| 2014 | $464 | $13,425 | $4,200 | $9,225 |
Source: Public Records
Map
Nearby Homes
- 3804 Haddock Ave
- 2732 Vita Dr
- 2740 Vita Dr
- 2642 San Vincente Ct
- 3101 Cypress Ave
- 3402 Lillis Cir
- 3644 San Pascual Ave
- 2536 Statz St
- 2517 Belmont St
- 3572 Osaka Bay Ct
- 0 Belmont St
- 2514 Sandy Ln
- 2671 San Marcos St
- 2294 N Pecos Rd Unit 4
- 2294 N Pecos Rd
- 3024 Orr Ave
- 2549 San Marcos St
- 2741 San Domingo Ln
- 2481 San Marcos St
- 2728 Haddock Ave
- 3500 E Cartier Ave
- 2561 Kenneth Rd
- 3509 Canoga Ave
- 3505 Canoga Ave
- 3515 Canoga Ave
- 3501 Canoga Ave
- 2557 Kenneth Rd
- 3504 E Cartier Ave
- 3517 Canoga Ave
- 3417 Canoga Ave
- 3501 E Cartier Ave
- 2553 Kenneth Rd
- 3508 E Cartier Ave
- 3505 E Cartier Ave
- 3521 Canoga Ave
- 2552 Herrod Dr
- 3415 Canoga Ave
- 2549 Kenneth Rd
- 3509 E Cartier Ave
- 3508 E Canoga Ave