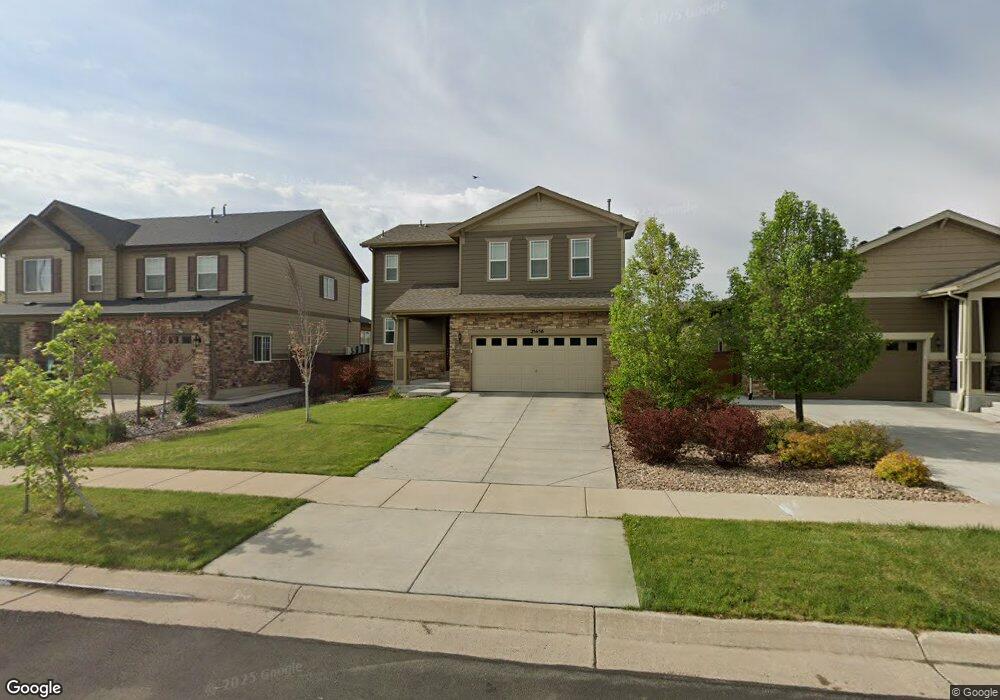
25656 E Bayaud Place Aurora, CO 80018
Estimated Value: $488,000 - $673,000
4
Beds
3
Baths
1,831
Sq Ft
$299/Sq Ft
Est. Value
About This Home
This home is located at 25656 E Bayaud Place, Aurora, CO 80018 and is currently estimated at $547,965, approximately $299 per square foot. 25656 E Bayaud Place is a home located in Arapahoe County with nearby schools including Vista Peak Exploratory and Vista Peak 9-12 Preparatory.
Ownership History
Date
Name
Owned For
Owner Type
Purchase Details
Closed on
Feb 28, 2022
Sold by
Jesby Cruz
Bought by
Cruz Jesby and Arce Yesenia
Current Estimated Value
Home Financials for this Owner
Home Financials are based on the most recent Mortgage that was taken out on this home.
Original Mortgage
$404,500
Outstanding Balance
$375,208
Interest Rate
3.92%
Mortgage Type
New Conventional
Estimated Equity
$172,757
Purchase Details
Closed on
Feb 27, 2019
Sold by
Mukasa Tony B and Mukasa Erina C
Bought by
Cruz Jesby and Cruz Yesenia
Home Financials for this Owner
Home Financials are based on the most recent Mortgage that was taken out on this home.
Original Mortgage
$349,358
Interest Rate
4.75%
Mortgage Type
FHA
Purchase Details
Closed on
Mar 30, 2017
Sold by
Richmond American Homes Of Colorado Inc
Bought by
Mukasa Tony B and Mukasa Erina C
Home Financials for this Owner
Home Financials are based on the most recent Mortgage that was taken out on this home.
Original Mortgage
$313,648
Interest Rate
4.15%
Mortgage Type
New Conventional
Create a Home Valuation Report for This Property
The Home Valuation Report is an in-depth analysis detailing your home's value as well as a comparison with similar homes in the area
Purchase History
| Date | Buyer | Sale Price | Title Company |
|---|---|---|---|
| Cruz Jesby | -- | Homestead Title & Escrow | |
| Cruz Jesby | $381,500 | Heritage Title Company | |
| Mukasa Tony B | $330,200 | Guardian Title Agency Llc |
Source: Public Records
Mortgage History
| Date | Status | Borrower | Loan Amount |
|---|---|---|---|
| Open | Cruz Jesby | $404,500 | |
| Previous Owner | Cruz Jesby | $349,358 | |
| Previous Owner | Mukasa Tony B | $313,648 |
Source: Public Records
Tax History
| Year | Tax Paid | Tax Assessment Tax Assessment Total Assessment is a certain percentage of the fair market value that is determined by local assessors to be the total taxable value of land and additions on the property. | Land | Improvement |
|---|---|---|---|---|
| 2025 | $4,168 | $32,175 | -- | -- |
| 2024 | $4,069 | $34,612 | -- | -- |
| 2023 | $4,069 | $34,612 | $0 | $0 |
| 2022 | $3,624 | $27,272 | $0 | $0 |
| 2021 | $3,738 | $27,272 | $0 | $0 |
| 2020 | $3,673 | $26,885 | $0 | $0 |
| 2019 | $3,658 | $26,885 | $0 | $0 |
| 2018 | $3,419 | $23,342 | $0 | $0 |
| 2017 | $1,409 | $10,304 | $0 | $0 |
| 2016 | $291 | $2,152 | $0 | $0 |
| 2015 | $307 | $2,152 | $0 | $0 |
| 2014 | $292 | $1,997 | $0 | $0 |
| 2013 | -- | $2,770 | $0 | $0 |
Source: Public Records
Map
Nearby Homes
- 25656 E Bayaud Ave
- 25562 E Bayaud Place
- 25605 E Maple Place
- 25585 E Maple Place
- 25526 E Maple Ave
- 25771 E Archer Ave
- 166 S Kewaunee Way
- 25822 E Archer Dr
- 25876 E Maple Place
- 2167 S Jackson Gap Way
- 33 N Jamestown Way
- 119 S Oak Hill Ct
- 26168 E Maple Dr
- 75 N Newcastle Ct
- 664 N Yantley St
- 27853 E 8th Ave
- 27837 E 9th Ln
- 27934 E 7th Ave
- 27922 E 10th Dr
- 27646 E 10th Dr
- 25646 E Bayaud Ave
- 25676 E Bayaud Ave
- 25626 E Bayaud Ave
- 25647 E Maple Ave
- 25606 E Bayaud Ave
- 140 S Langdale Ct
- 25663 E Bayaud Ave
- 25623 E Bayaud Ave
- 25627 E Maple Ave
- 25613 E Bayaud Ave
- 25586 E Bayaud Ave
- 25607 E Maple Ave
- 150 S Langdale Ct
- 26920 E Maple Ave
- 119 S Millbrook St
- 129 S Millbrook St
- 25587 E Maple Dr
- 25587 E Maple Ave
- 25563 E Bayaud Ave
- 139 S Millbrook St
Your Personal Tour Guide
Ask me questions while you tour the home.