2566 E Cygnet Cir Sparks, NV 89431
Downtown Sparks NeighborhoodEstimated Value: $433,573 - $546,000
5
Beds
2
Baths
1,896
Sq Ft
$254/Sq Ft
Est. Value
About This Home
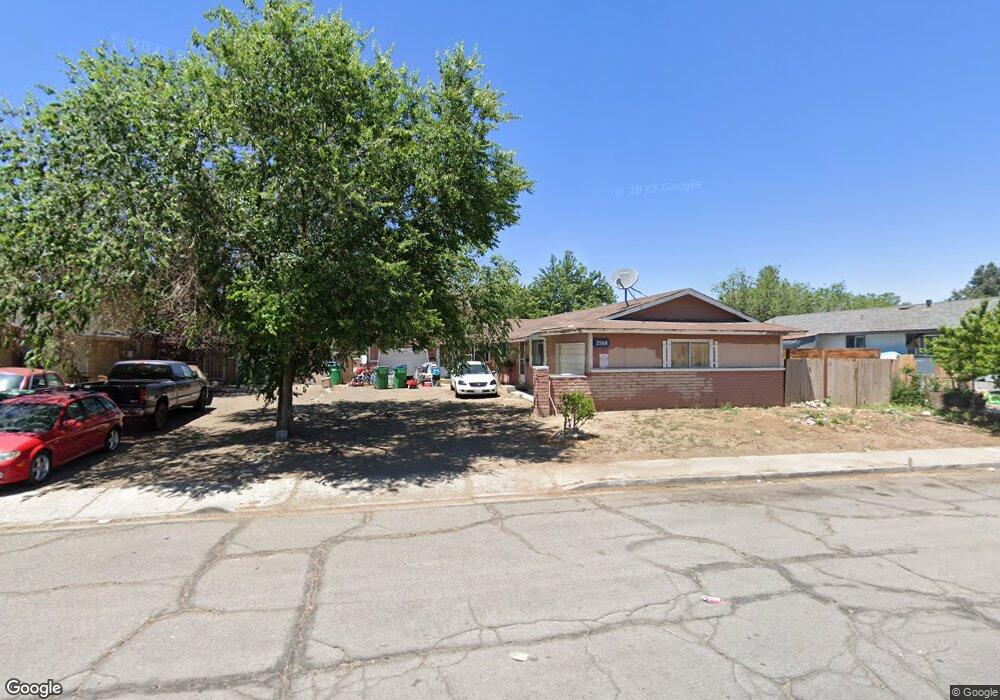
This home is located at 2566 E Cygnet Cir, Sparks, NV 89431 and is currently estimated at $481,393, approximately $253 per square foot. 2566 E Cygnet Cir is a home located in Washoe County with nearby schools including Bernice Mathews Elementary School, Fred W. Traner Middle School, and Procter R. Hug High School.
Ownership History
Date
Name
Owned For
Owner Type
Purchase Details
Closed on
Mar 21, 2011
Sold by
Vps Llc
Bought by
Garcia Miguel N and Garcia Maribel
Current Estimated Value
Purchase Details
Closed on
Nov 2, 2002
Sold by
Bird Margaret A
Bought by
Vps Llc
Home Financials for this Owner
Home Financials are based on the most recent Mortgage that was taken out on this home.
Original Mortgage
$112,800
Interest Rate
5.99%
Purchase Details
Closed on
Oct 28, 2002
Sold by
Price Ben H and Price Judith P
Bought by
Bird Margaret A
Home Financials for this Owner
Home Financials are based on the most recent Mortgage that was taken out on this home.
Original Mortgage
$112,800
Interest Rate
5.99%
Purchase Details
Closed on
Dec 18, 1993
Sold by
Ghaffar Adli Reza Ghaffar and Ghaffar Adli Akram
Bought by
Ghaffar Adli Reza Ghaffar and Ghaffar Adli Akram
Create a Home Valuation Report for This Property
The Home Valuation Report is an in-depth analysis detailing your home's value as well as a comparison with similar homes in the area
Home Values in the Area
Average Home Value in this Area
Purchase History
| Date | Buyer | Sale Price | Title Company |
|---|---|---|---|
| Garcia Miguel N | $90,000 | First American Title Reno | |
| Vps Llc | $141,000 | First American Title | |
| Bird Margaret A | $141,000 | First American Title | |
| Ghaffar Adli Reza Ghaffar | -- | -- |
Source: Public Records
Mortgage History
| Date | Status | Borrower | Loan Amount |
|---|---|---|---|
| Previous Owner | Bird Margaret A | $112,800 |
Source: Public Records
Tax History Compared to Growth
Tax History
| Year | Tax Paid | Tax Assessment Tax Assessment Total Assessment is a certain percentage of the fair market value that is determined by local assessors to be the total taxable value of land and additions on the property. | Land | Improvement |
|---|---|---|---|---|
| 2025 | $1,311 | $62,099 | $41,720 | $20,379 |
| 2024 | $1,311 | $59,615 | $38,710 | $20,905 |
| 2023 | $1,215 | $58,404 | $39,305 | $19,099 |
| 2022 | $1,180 | $49,928 | $32,865 | $17,063 |
| 2021 | $1,146 | $42,980 | $25,375 | $17,605 |
| 2020 | $1,111 | $44,504 | $26,250 | $18,254 |
| 2019 | $1,080 | $40,634 | $22,470 | $18,164 |
| 2018 | $1,049 | $33,413 | $15,190 | $18,223 |
| 2017 | $1,019 | $32,518 | $14,000 | $18,518 |
| 2016 | $993 | $30,583 | $11,200 | $19,383 |
| 2015 | $746 | $28,172 | $8,050 | $20,122 |
| 2014 | $963 | $26,507 | $7,000 | $19,507 |
| 2013 | -- | $25,678 | $6,160 | $19,518 |
Source: Public Records
Map
Nearby Homes
- 2335 Roundhouse Rd
- 2380 Roundhouse Rd
- 2385 Pauline Ave
- 2136 Roundhouse Rd
- 2168 Cannonball Rd
- 135 Carnation Ln
- 168 Poppy Ln
- 113 Lilac Ln
- 112 Lilac Ln
- 1889 Merchant St
- 1830 C St
- 2301 Oddie Blvd Unit 56
- 2301 Oddie Blvd Unit 162
- 2301 Oddie Blvd Unit 18
- 1756 I St
- 1841 Merchant St
- 1990 Trainer Way
- 1885 Castle Way
- 1720 G St
- 234 18th St
- 2566 E Cygnet Cir Unit 2566, 2568
- 2562 E Cygnet Cir
- 2590 E Cygnet Cir
- 2594 E Cygnet Cir
- 2618 W Cygnet Cir
- 2558 E Cygnet Cir
- 2622 W Cygnet Cir Unit 2
- 2622 W Cygnet Cir
- 2610 W Cygnet Cir
- 2626 W Cygnet Cir
- 2567 E Cygnet Cir Unit 2
- 2567 E Cygnet Cir
- 2563 E Cygnet Cir
- 2554 E Cygnet Cir Unit 2554, 2556
- 2554 E Cygnet Cir
- 2571 E Cygnet Cir
- 2559 E Cygnet Cir
- 2559 E Cygnet Cir
- 2630 W Cygnet Cir
- 2575 E Cygnet Cir