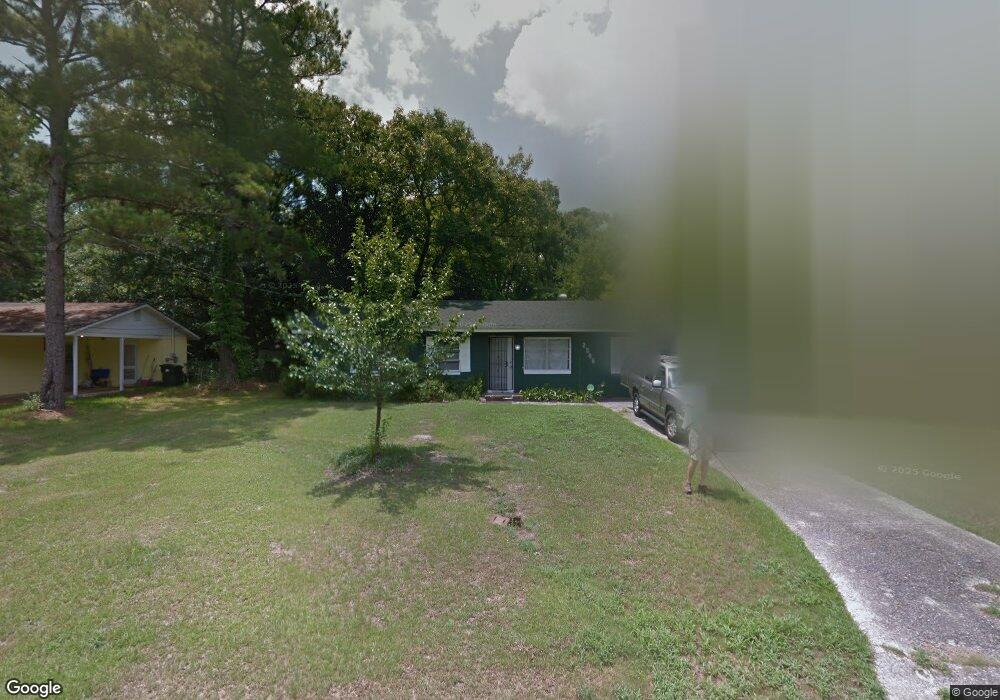
2566 Echols Place Macon, GA 31206
Estimated Value: $82,000 - $110,000
3
Beds
1
Bath
1,152
Sq Ft
$84/Sq Ft
Est. Value
About This Home
This home is located at 2566 Echols Place, Macon, GA 31206 and is currently estimated at $96,264, approximately $83 per square foot. 2566 Echols Place is a home located in Bibb County with nearby schools including Southfield Elementary School, Southwest High School, and Gilead Christian Academy.
Ownership History
Date
Name
Owned For
Owner Type
Purchase Details
Closed on
Oct 23, 2023
Sold by
Watson Andrew
Bought by
Rmg Macon Holdings Llc
Current Estimated Value
Purchase Details
Closed on
Mar 15, 2019
Sold by
Gibson Ashawna and Dennard Mikeal
Bought by
Watson Andrew
Purchase Details
Closed on
Feb 10, 2016
Sold by
Perkins Anna Bell
Bought by
Gibson Ashawna and Dennard Mikeal
Purchase Details
Closed on
May 29, 2015
Sold by
John Margaret
Bought by
Perkins Anna Bell
Purchase Details
Closed on
May 11, 2015
Sold by
Brantley Jerry M
Bought by
John Margaret
Purchase Details
Closed on
May 6, 2015
Sold by
Brantley Deborah B
Bought by
Brantley Jack M
Purchase Details
Closed on
Mar 26, 2015
Sold by
Brantley Jerry M
Bought by
John Margaret
Purchase Details
Closed on
Dec 12, 1996
Sold by
Swain Rosa Lee Fka Brantley Rosa Le
Bought by
Brantley Jack M
Create a Home Valuation Report for This Property
The Home Valuation Report is an in-depth analysis detailing your home's value as well as a comparison with similar homes in the area
Home Values in the Area
Average Home Value in this Area
Purchase History
| Date | Buyer | Sale Price | Title Company |
|---|---|---|---|
| Rmg Macon Holdings Llc | -- | None Listed On Document | |
| Rmg Macon Holdings Llc | -- | None Listed On Document | |
| Watson Andrew | $24,000 | None Available | |
| Gibson Ashawna | $18,000 | -- | |
| Perkins Anna Bell | $20,000 | None Available | |
| John Margaret | -- | None Available | |
| Brantley Jack M | -- | None Available | |
| John Margaret | -- | None Available | |
| Brantley Margaret B | -- | None Available | |
| John Margaret | -- | None Available | |
| Brantley Jack M | -- | -- |
Source: Public Records
Tax History Compared to Growth
Tax History
| Year | Tax Paid | Tax Assessment Tax Assessment Total Assessment is a certain percentage of the fair market value that is determined by local assessors to be the total taxable value of land and additions on the property. | Land | Improvement |
|---|---|---|---|---|
| 2025 | $695 | $28,272 | $2,800 | $25,472 |
| 2024 | $718 | $28,272 | $2,800 | $25,472 |
| 2023 | $617 | $24,283 | $1,120 | $23,163 |
| 2022 | $640 | $18,476 | $3,545 | $14,931 |
| 2021 | $574 | $15,095 | $2,482 | $12,613 |
| 2020 | $334 | $8,592 | $1,773 | $6,819 |
| 2019 | $336 | $8,592 | $1,773 | $6,819 |
| 2018 | $617 | $7,290 | $1,773 | $5,517 |
| 2017 | $270 | $7,290 | $1,773 | $5,517 |
| 2016 | $277 | $8,856 | $1,773 | $7,083 |
| 2015 | $498 | $10,162 | $1,773 | $8,389 |
| 2014 | $52 | $10,162 | $1,773 | $8,389 |
Source: Public Records
Map
Nearby Homes
- 2572 Echols Place
- 2560 Echols Place
- 2559 Burbank Place
- 2554 Echols Place
- 2551 Burbank Place
- 2567 Burbank Place
- 2582 Echols Place
- 4514 Dorset Dr
- 2567 Echols Place
- 2561 Echols Place
- 2543 Burbank Place
- 2573 Echols Place
- 2555 Echols Place
- 2544 Echols Place
- 2579 Echols Place
- 4524 Dorset Dr
- 2535 Burbank Place
- 2549 Echols Place
- 2585 Echols Place
- 0 Burbank Place Unit 8613080