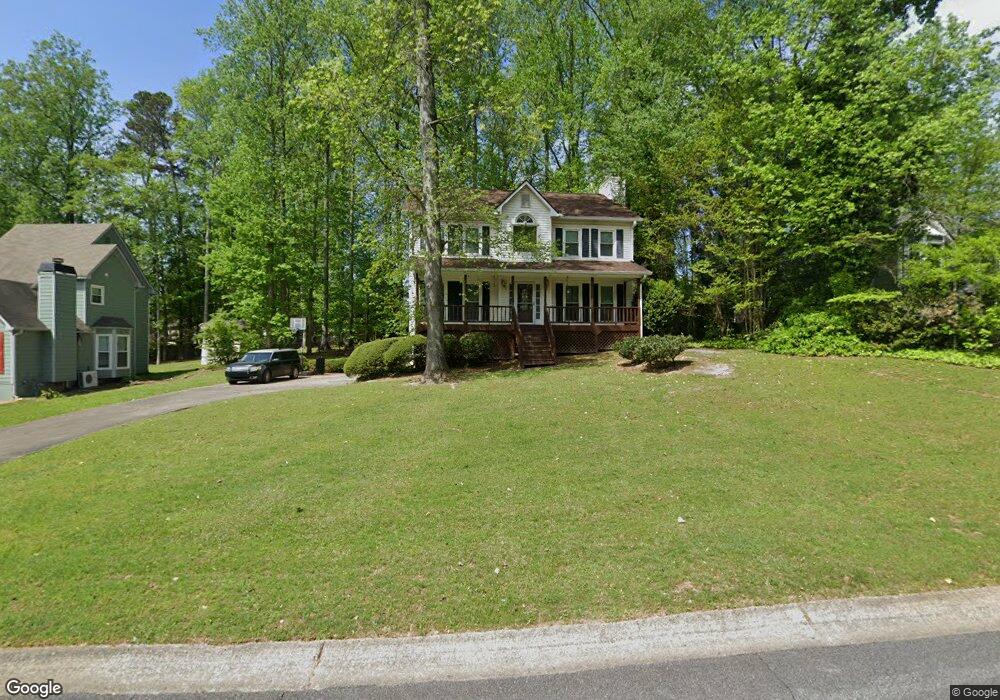
2566 Overlake Dr Unit 5 Powder Springs, GA 30127
Estimated Value: $352,502 - $363,000
3
Beds
3
Baths
1,988
Sq Ft
$180/Sq Ft
Est. Value
About This Home
This home is located at 2566 Overlake Dr Unit 5, Powder Springs, GA 30127 and is currently estimated at $358,376, approximately $180 per square foot. 2566 Overlake Dr Unit 5 is a home located in Cobb County with nearby schools including Dowell Elementary School, Tapp Middle School, and McEachern High School.
Ownership History
Date
Name
Owned For
Owner Type
Purchase Details
Closed on
Mar 13, 2024
Sold by
Garrett Sherry B and Garrett Shawn
Bought by
Garrett Sherry B
Current Estimated Value
Home Financials for this Owner
Home Financials are based on the most recent Mortgage that was taken out on this home.
Original Mortgage
$170,940
Outstanding Balance
$159,200
Interest Rate
5.94%
Mortgage Type
FHA
Estimated Equity
$199,176
Purchase Details
Closed on
Jan 30, 2003
Sold by
Watkins Jerry and Watkins Debbie
Bought by
Garrett Sherry B and Garrett Shawn G
Home Financials for this Owner
Home Financials are based on the most recent Mortgage that was taken out on this home.
Original Mortgage
$157,872
Interest Rate
5.89%
Mortgage Type
FHA
Purchase Details
Closed on
Aug 16, 2002
Sold by
Crosby Constance H
Bought by
Watkins Jerry and Watkins Debbie
Home Financials for this Owner
Home Financials are based on the most recent Mortgage that was taken out on this home.
Original Mortgage
$145,500
Interest Rate
6.52%
Mortgage Type
New Conventional
Create a Home Valuation Report for This Property
The Home Valuation Report is an in-depth analysis detailing your home's value as well as a comparison with similar homes in the area
Home Values in the Area
Average Home Value in this Area
Purchase History
| Date | Buyer | Sale Price | Title Company |
|---|---|---|---|
| Garrett Sherry B | -- | Mortgage Connect | |
| Garrett Sherry B | $159,200 | -- | |
| Watkins Jerry | $150,000 | -- |
Source: Public Records
Mortgage History
| Date | Status | Borrower | Loan Amount |
|---|---|---|---|
| Open | Garrett Sherry B | $170,940 | |
| Previous Owner | Garrett Sherry B | $157,872 | |
| Previous Owner | Watkins Jerry | $145,500 |
Source: Public Records
Tax History Compared to Growth
Tax History
| Year | Tax Paid | Tax Assessment Tax Assessment Total Assessment is a certain percentage of the fair market value that is determined by local assessors to be the total taxable value of land and additions on the property. | Land | Improvement |
|---|---|---|---|---|
| 2025 | $4,754 | $157,772 | $32,000 | $125,772 |
| 2024 | $3,644 | $120,864 | $30,000 | $90,864 |
| 2023 | $3,693 | $122,476 | $16,000 | $106,476 |
| 2022 | $3,435 | $113,164 | $12,000 | $101,164 |
| 2021 | $2,142 | $70,588 | $12,000 | $58,588 |
| 2020 | $2,142 | $70,588 | $12,000 | $58,588 |
| 2019 | $2,014 | $66,344 | $8,000 | $58,344 |
| 2018 | $2,014 | $66,344 | $8,000 | $58,344 |
| 2017 | $1,715 | $59,648 | $8,000 | $51,648 |
| 2016 | $1,715 | $59,648 | $8,000 | $51,648 |
| 2015 | $1,527 | $51,824 | $4,800 | $47,024 |
| 2014 | $997 | $33,572 | $0 | $0 |
Source: Public Records
Map
Nearby Homes
- 3161 Tucson Ct Unit 8
- 2691 Tucson Way
- 3272 Barnwell Trace
- 2657 John Petree Rd
- 2627 Beaver Creek Crossing
- 2885 Mondavi Place
- 2752 Owens Ave SW Unit 5
- 2599 Candler Way SW
- 2723 Horseshoe Creek Dr SW
- 2705 Owens Ave SW
- 3235 Avondale Pkwy
- 3493 Ridgecrest Dr
- 2625 Deerfield Cir SW
- 2445 Hopkins Rd
- 3517 Ridgecrest Dr
- 2335 Corbett Ct
- 2730 Hembree Rd SW
- 2568 Overlake Dr
- 2564 Overlake Dr
- 3151 Tucson Ct
- 2562 Overlake Dr
- 2570 Overlake Dr
- 2569 Overlake Dr Unit 256
- 2569 Overlake Dr
- 2569 Overlake Dr
- 2565 Overlake Dr
- 2665 Tucson Way Unit 9
- 2563 Overlake Dr
- 2572 Overlake Dr
- 2667 Tucson Way Unit 9
- 3150 Tucson Ct
- 3099 Country Lake Ct
- 0 Country Lake Ct Unit 3225501
- 0 Country Lake Ct Unit 3183797
- 0 Country Lake Ct Unit 8422398
- 3165 Tucson Ct Unit 8
- 2560 Overlake Dr Unit 6