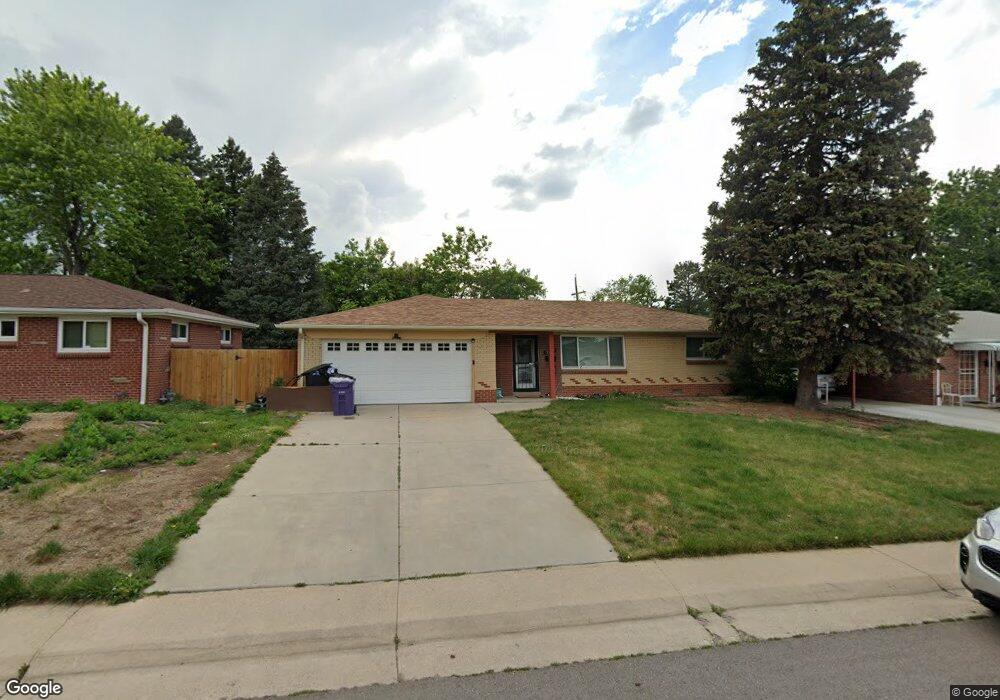
2567 S Stuart St Denver, CO 80219
Harvey Park NeighborhoodEstimated Value: $497,000 - $532,000
3
Beds
2
Baths
1,111
Sq Ft
$457/Sq Ft
Est. Value
About This Home
This home is located at 2567 S Stuart St, Denver, CO 80219 and is currently estimated at $507,801, approximately $457 per square foot. 2567 S Stuart St is a home located in Denver County with nearby schools including Doull Elementary School, Bear Valley International School, and John F Kennedy High School.
Ownership History
Date
Name
Owned For
Owner Type
Purchase Details
Closed on
Apr 8, 2024
Sold by
Avila Michael
Bought by
Avila Michael and Martinez Shirley
Current Estimated Value
Home Financials for this Owner
Home Financials are based on the most recent Mortgage that was taken out on this home.
Original Mortgage
$490,806
Outstanding Balance
$481,641
Interest Rate
6.88%
Mortgage Type
FHA
Estimated Equity
$26,160
Purchase Details
Closed on
Nov 14, 2022
Sold by
Cruz Miguel
Bought by
Avila Michael
Home Financials for this Owner
Home Financials are based on the most recent Mortgage that was taken out on this home.
Original Mortgage
$489,961
Interest Rate
7.08%
Purchase Details
Closed on
Mar 8, 1996
Sold by
Simpson Robert F and Simpson Violet
Bought by
Cruz Miguel
Home Financials for this Owner
Home Financials are based on the most recent Mortgage that was taken out on this home.
Original Mortgage
$111,708
Interest Rate
7.03%
Mortgage Type
FHA
Create a Home Valuation Report for This Property
The Home Valuation Report is an in-depth analysis detailing your home's value as well as a comparison with similar homes in the area
Home Values in the Area
Average Home Value in this Area
Purchase History
| Date | Buyer | Sale Price | Title Company |
|---|---|---|---|
| Avila Michael | -- | None Listed On Document | |
| Avila Michael | $499,000 | -- | |
| Cruz Miguel | $112,500 | Commonwealth Land Title |
Source: Public Records
Mortgage History
| Date | Status | Borrower | Loan Amount |
|---|---|---|---|
| Open | Avila Michael | $490,806 | |
| Previous Owner | Avila Michael | $489,961 | |
| Previous Owner | Cruz Miguel | $111,708 |
Source: Public Records
Tax History
| Year | Tax Paid | Tax Assessment Tax Assessment Total Assessment is a certain percentage of the fair market value that is determined by local assessors to be the total taxable value of land and additions on the property. | Land | Improvement |
|---|---|---|---|---|
| 2025 | $2,513 | $36,640 | $7,790 | $7,790 |
| 2024 | $2,513 | $31,730 | $3,720 | $28,010 |
| 2023 | $2,459 | $31,730 | $3,720 | $28,010 |
| 2022 | $1,941 | $24,410 | $7,680 | $16,730 |
| 2021 | $1,874 | $25,110 | $7,900 | $17,210 |
| 2020 | $1,756 | $23,670 | $7,370 | $16,300 |
| 2019 | $1,707 | $23,670 | $7,370 | $16,300 |
| 2018 | $1,457 | $18,830 | $6,370 | $12,460 |
| 2017 | $1,452 | $18,830 | $6,370 | $12,460 |
| 2016 | $1,264 | $15,500 | $5,859 | $9,641 |
| 2015 | $1,211 | $15,500 | $5,859 | $9,641 |
| 2014 | $1,066 | $12,830 | $2,929 | $9,901 |
Source: Public Records
Map
Nearby Homes
- 2592 S Uno Way
- 2562 S Quitman St
- 2571 S Perry St
- 2597 S Perry St
- 2580 S Perry St
- 4465 W Yale Ave
- 2702 S Stuart St
- 2636 S Osceola St
- 5005 W Lakeridge Rd
- 2751 S Yates St
- 2800 S Perry St
- 2704 S Zurich Ct
- 2505 S King St
- 2725 S Zurich Ct
- 2845 S Winona Ct
- 4760 W Evans Ave
- 2768 S Mabry Way
- 2650 S Sheridan Ct Unit 2
- 2906 S Stuart St
- 2675 S Sheridan Ct Unit 3
- 2557 S Stuart St
- 2577 S Stuart St
- 2587 S Stuart St
- 2553 S Stuart St
- 2568 S Tennyson Way
- 2578 S Tennyson Way
- 2566 S Stuart St
- 2576 S Stuart St
- 2558 S Tennyson Way
- 2556 S Stuart St
- 2588 S Tennyson Way
- 2586 S Stuart St
- 2554 S Tennyson Way
- 2593 S Stuart St
- 2530 S Tennyson Way
- 2552 S Stuart St
- 2548 S Tennyson Way
- 2592 S Stuart St
- 2594 S Tennyson Way
- 4305 W Vassar Ave
Your Personal Tour Guide
Ask me questions while you tour the home.