Estimated Value: $370,000 - $396,000
4
Beds
3
Baths
1,656
Sq Ft
$229/Sq Ft
Est. Value
About This Home
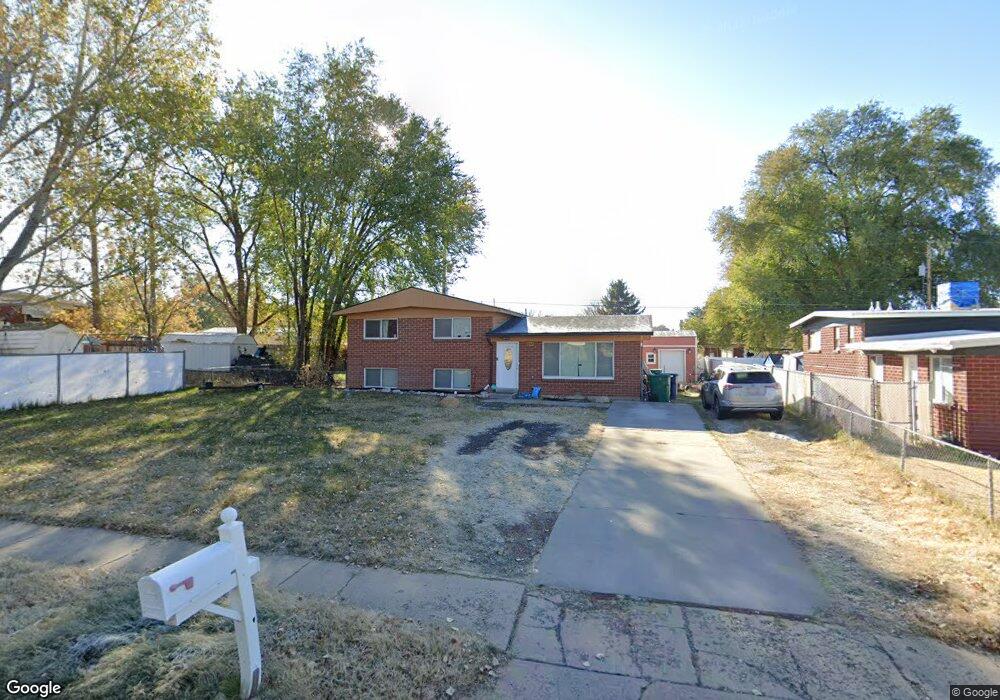
This home is located at 2567 W 5750 S, Roy, UT 84067 and is currently estimated at $379,573, approximately $229 per square foot. 2567 W 5750 S is a home located in Weber County with nearby schools including Roy Junior High School, Roy High School, and Voyage Academy.
Ownership History
Date
Name
Owned For
Owner Type
Purchase Details
Closed on
Nov 9, 2012
Sold by
Barker Shane C
Bought by
Hall Tiffanee
Current Estimated Value
Home Financials for this Owner
Home Financials are based on the most recent Mortgage that was taken out on this home.
Original Mortgage
$6,500
Outstanding Balance
$4,481
Interest Rate
3.34%
Mortgage Type
Purchase Money Mortgage
Estimated Equity
$375,092
Purchase Details
Closed on
Jun 7, 2012
Sold by
Byrd Paul M and Byrd Tammy R
Bought by
Barker Shane C
Purchase Details
Closed on
Jun 25, 2004
Sold by
Jones Randall C and Jones Andrea S
Bought by
Byrd Paul M and Byrd Tammy R
Purchase Details
Closed on
Jun 27, 2000
Sold by
Mcbride Kathleen
Bought by
Jones Randall C and Jones Andrea S
Home Financials for this Owner
Home Financials are based on the most recent Mortgage that was taken out on this home.
Original Mortgage
$84,400
Interest Rate
8.67%
Mortgage Type
FHA
Create a Home Valuation Report for This Property
The Home Valuation Report is an in-depth analysis detailing your home's value as well as a comparison with similar homes in the area
Home Values in the Area
Average Home Value in this Area
Purchase History
| Date | Buyer | Sale Price | Title Company |
|---|---|---|---|
| Hall Tiffanee | -- | Founders Title Company Syrac | |
| Barker Shane C | $63,144 | Founders Title Company | |
| Byrd Paul M | -- | Security Title | |
| Jones Randall C | -- | Associated Title |
Source: Public Records
Mortgage History
| Date | Status | Borrower | Loan Amount |
|---|---|---|---|
| Open | Hall Tiffanee | $6,500 | |
| Previous Owner | Jones Randall C | $84,400 |
Source: Public Records
Tax History Compared to Growth
Tax History
| Year | Tax Paid | Tax Assessment Tax Assessment Total Assessment is a certain percentage of the fair market value that is determined by local assessors to be the total taxable value of land and additions on the property. | Land | Improvement |
|---|---|---|---|---|
| 2025 | $2,392 | $375,274 | $115,084 | $260,190 |
| 2024 | $2,313 | $200,749 | $63,306 | $137,443 |
| 2023 | $2,144 | $185,350 | $59,094 | $126,256 |
| 2022 | $2,390 | $215,600 | $56,726 | $158,874 |
| 2021 | $1,792 | $262,000 | $67,293 | $194,707 |
| 2020 | $1,709 | $230,000 | $67,293 | $162,707 |
| 2019 | $1,652 | $209,000 | $41,829 | $167,171 |
| 2018 | $1,492 | $176,000 | $36,842 | $139,158 |
| 2017 | $1,407 | $155,000 | $36,842 | $118,158 |
| 2016 | $1,277 | $74,779 | $19,913 | $54,866 |
| 2015 | $1,170 | $69,695 | $22,658 | $47,037 |
| 2014 | $1,099 | $64,037 | $17,131 | $46,906 |
Source: Public Records
Map
Nearby Homes
- 2587 W 5750 S
- 2571 W 5725 S
- 5810 S 2550 W
- 5923 S 2625 W
- 2646 W 5625 S Unit M-2646
- 5643 S 2200 W
- 2829 W 5925 S
- 2778 W 5550 S Unit 28
- 484 W 2650 N
- 480 W 2650 N
- 2612 N 525 W
- 428 W 2650 N
- 2602 N 2125 W
- 2593 N 500 W Unit 56
- 2932 W 6050 S
- 2486 N 690 W
- 2184 W 5500 S
- 5345 S 2425 W
- 1154 W 2600 N
- 5326 S 2675 W