Estimated Value: $382,000 - $399,000
4
Beds
1
Bath
1,028
Sq Ft
$383/Sq Ft
Est. Value
About This Home
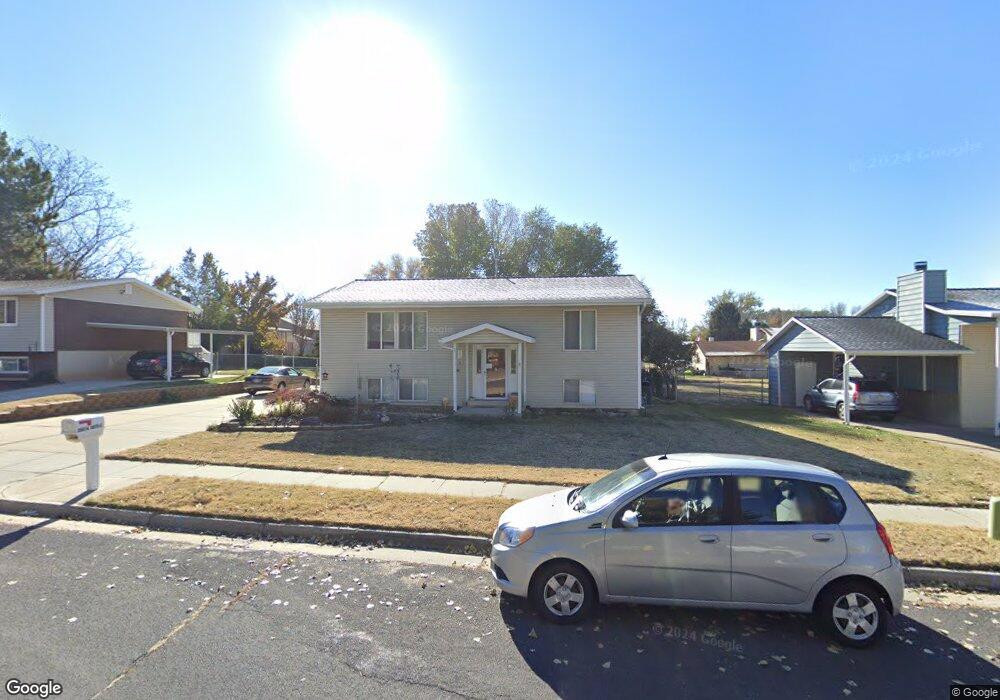
This home is located at 2567 W 6075 S, Roy, UT 84067 and is currently estimated at $393,544, approximately $382 per square foot. 2567 W 6075 S is a home located in Weber County with nearby schools including Municipal School, Roy Junior High School, and Roy High School.
Ownership History
Date
Name
Owned For
Owner Type
Purchase Details
Closed on
Apr 9, 2014
Sold by
Davis Terri L
Bought by
Davis Terri Lynn
Current Estimated Value
Purchase Details
Closed on
Oct 21, 1996
Sold by
Rich Welch
Bought by
Davis Donald Scot and Davis Terri L
Home Financials for this Owner
Home Financials are based on the most recent Mortgage that was taken out on this home.
Original Mortgage
$88,640
Outstanding Balance
$8,341
Interest Rate
8.37%
Mortgage Type
FHA
Estimated Equity
$385,203
Purchase Details
Closed on
Oct 18, 1996
Sold by
Ifco
Bought by
Welch Thomas A
Home Financials for this Owner
Home Financials are based on the most recent Mortgage that was taken out on this home.
Original Mortgage
$88,640
Outstanding Balance
$8,341
Interest Rate
8.37%
Mortgage Type
FHA
Estimated Equity
$385,203
Purchase Details
Closed on
Jun 2, 1981
Sold by
Gonzales Leonard and Gonzales Jeanie
Bought by
Welch Thomas A
Purchase Details
Closed on
Aug 17, 1976
Sold by
Butler Alma S
Bought by
Gonzales Leonard and Gonzales Jeanie
Create a Home Valuation Report for This Property
The Home Valuation Report is an in-depth analysis detailing your home's value as well as a comparison with similar homes in the area
Home Values in the Area
Average Home Value in this Area
Purchase History
| Date | Buyer | Sale Price | Title Company |
|---|---|---|---|
| Davis Terri Lynn | -- | None Available | |
| Davis Donald Scot | -- | Cardon Land Title | |
| Rich Welch | -- | Cardon Land Title | |
| Welch Thomas A | -- | Cardon Land Title | |
| Welch Thomas A | -- | Cardon Land Title | |
| Gonzales Leonard | -- | Cardon Land Title |
Source: Public Records
Mortgage History
| Date | Status | Borrower | Loan Amount |
|---|---|---|---|
| Open | Davis Donald Scot | $88,640 |
Source: Public Records
Tax History Compared to Growth
Tax History
| Year | Tax Paid | Tax Assessment Tax Assessment Total Assessment is a certain percentage of the fair market value that is determined by local assessors to be the total taxable value of land and additions on the property. | Land | Improvement |
|---|---|---|---|---|
| 2025 | $2,514 | $396,698 | $125,233 | $271,465 |
| 2024 | $2,319 | $201,299 | $68,878 | $132,421 |
| 2023 | $2,217 | $192,500 | $67,156 | $125,344 |
| 2022 | $2,357 | $212,300 | $59,493 | $152,807 |
| 2021 | $1,913 | $282,000 | $77,323 | $204,677 |
| 2020 | $1,841 | $250,000 | $77,323 | $172,677 |
| 2019 | $1,722 | $219,000 | $46,848 | $172,152 |
| 2018 | $1,574 | $187,000 | $41,829 | $145,171 |
| 2017 | $1,541 | $172,000 | $38,837 | $133,163 |
| 2016 | $1,404 | $83,502 | $17,131 | $66,371 |
| 2015 | $1,223 | $73,437 | $17,131 | $56,306 |
| 2014 | $1,209 | $71,726 | $17,131 | $54,595 |
Source: Public Records
Map
Nearby Homes