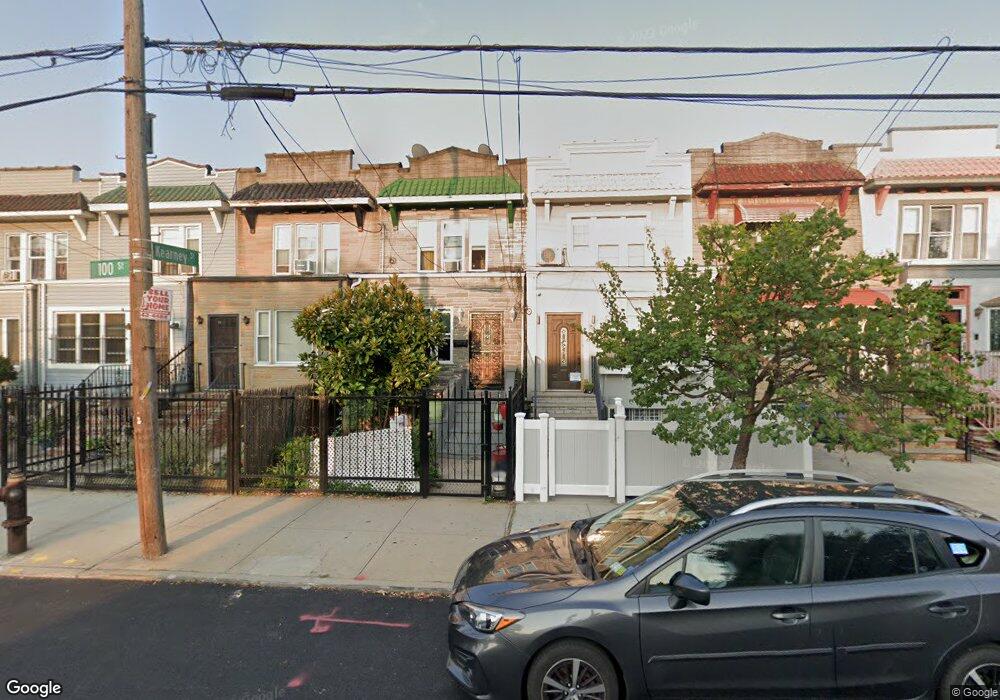
2568 100th St East Elmhurst, NY 11369
East Elmhurst NeighborhoodEstimated Value: $801,000 - $901,000
--
Bed
--
Bath
1,444
Sq Ft
$590/Sq Ft
Est. Value
About This Home
This home is located at 2568 100th St, East Elmhurst, NY 11369 and is currently estimated at $851,754, approximately $589 per square foot. 2568 100th St is a home located in Queens County with nearby schools including P.S. 127 Aerospace Science Magnet School, I.S. 145 Joseph Pulitzer Magnet School, and William Cullen Bryant High School.
Ownership History
Date
Name
Owned For
Owner Type
Purchase Details
Closed on
Dec 26, 2017
Sold by
2568 100 St Llc
Bought by
Fink Brian and Titolo Jacqueline
Current Estimated Value
Home Financials for this Owner
Home Financials are based on the most recent Mortgage that was taken out on this home.
Original Mortgage
$552,000
Outstanding Balance
$465,941
Interest Rate
3.95%
Mortgage Type
Purchase Money Mortgage
Estimated Equity
$385,813
Purchase Details
Closed on
May 23, 2017
Sold by
Estate Of Terrie Hamilton
Bought by
2568 100 St Llc
Home Financials for this Owner
Home Financials are based on the most recent Mortgage that was taken out on this home.
Original Mortgage
$300,000
Interest Rate
4.03%
Mortgage Type
Purchase Money Mortgage
Purchase Details
Closed on
Jan 27, 1997
Sold by
Boyd Errol S and Boyd Luisa A
Bought by
Hamilton Terrie
Home Financials for this Owner
Home Financials are based on the most recent Mortgage that was taken out on this home.
Original Mortgage
$115,031
Interest Rate
7.77%
Mortgage Type
FHA
Create a Home Valuation Report for This Property
The Home Valuation Report is an in-depth analysis detailing your home's value as well as a comparison with similar homes in the area
Home Values in the Area
Average Home Value in this Area
Purchase History
| Date | Buyer | Sale Price | Title Company |
|---|---|---|---|
| Fink Brian | $690,000 | -- | |
| 2568 100 St Llc | $383,000 | -- | |
| Hamilton Terrie | $125,000 | Chicago Title Insurance Co |
Source: Public Records
Mortgage History
| Date | Status | Borrower | Loan Amount |
|---|---|---|---|
| Open | Fink Brian | $552,000 | |
| Previous Owner | 2568 100 St Llc | $300,000 | |
| Previous Owner | Hamilton Terrie | $115,031 |
Source: Public Records
Tax History Compared to Growth
Tax History
| Year | Tax Paid | Tax Assessment Tax Assessment Total Assessment is a certain percentage of the fair market value that is determined by local assessors to be the total taxable value of land and additions on the property. | Land | Improvement |
|---|---|---|---|---|
| 2025 | $7,561 | $39,902 | $6,937 | $32,965 |
| 2024 | $7,561 | $37,643 | $7,228 | $30,415 |
| 2023 | $7,133 | $35,512 | $7,055 | $28,457 |
| 2022 | $6,790 | $47,280 | $8,940 | $38,340 |
| 2021 | $7,158 | $45,600 | $8,940 | $36,660 |
| 2020 | $7,067 | $41,520 | $8,940 | $32,580 |
| 2019 | $6,666 | $37,620 | $8,940 | $28,680 |
| 2018 | $5,176 | $25,393 | $6,480 | $18,913 |
| 2017 | $4,747 | $23,288 | $6,364 | $16,924 |
| 2016 | $4,655 | $23,288 | $6,364 | $16,924 |
| 2015 | $2,430 | $22,767 | $6,749 | $16,018 |
| 2014 | $2,430 | $21,496 | $7,534 | $13,962 |
Source: Public Records
Map
Nearby Homes
- 2561 99th St
- 2572 99th St
- 2556 100th St
- 2716 Mcintosh St
- 97-09 24th Ave
- 2545 97th St
- 31-41 97th St
- 27-32 Mcintosh St
- 97-17 31st Ave
- 26 W 97th St Unit 3A
- 25-19 97th St
- 97-18 25th Ave
- 26-17 96th St
- 100-22 31st Ave
- 31-30 100th St
- 31-15 101st St
- 31-14 102nd St
- 29-04 Humphreys St
- 24-24 Gillmore St
- 3123 102nd St