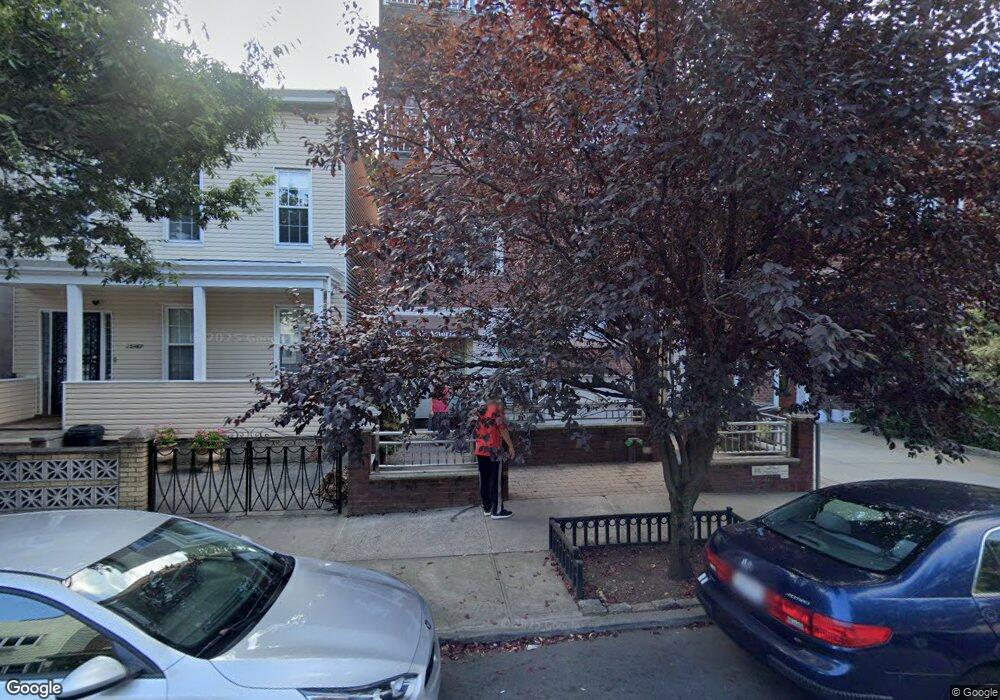
2569 38th St Unit 3F Astoria, NY 11103
Astoria NeighborhoodEstimated Value: $532,948 - $692,000
--
Bed
--
Bath
475
Sq Ft
$1,272/Sq Ft
Est. Value
About This Home
This home is located at 2569 38th St Unit 3F, Astoria, NY 11103 and is currently estimated at $604,237, approximately $1,272 per square foot. 2569 38th St Unit 3F is a home located in Queens County with nearby schools including I.S. 010 Horace Greeley, William Cullen Bryant High School, and Saint Demetrios School - Elementary School.
Ownership History
Date
Name
Owned For
Owner Type
Purchase Details
Closed on
Mar 20, 2019
Sold by
Theologos Michael
Bought by
Lenoach Jean Claude
Current Estimated Value
Home Financials for this Owner
Home Financials are based on the most recent Mortgage that was taken out on this home.
Original Mortgage
$330,000
Outstanding Balance
$288,342
Interest Rate
4.3%
Mortgage Type
New Conventional
Estimated Equity
$315,895
Purchase Details
Closed on
Aug 13, 2008
Sold by
2569 38Th Street Llc
Bought by
Theologos Michael
Home Financials for this Owner
Home Financials are based on the most recent Mortgage that was taken out on this home.
Original Mortgage
$185,000
Interest Rate
6.29%
Mortgage Type
Purchase Money Mortgage
Create a Home Valuation Report for This Property
The Home Valuation Report is an in-depth analysis detailing your home's value as well as a comparison with similar homes in the area
Home Values in the Area
Average Home Value in this Area
Purchase History
| Date | Buyer | Sale Price | Title Company |
|---|---|---|---|
| Lenoach Jean Claude | $530,000 | -- | |
| Lenoach Jean Claude | $530,000 | -- | |
| Theologos Michael | $345,000 | -- | |
| Theologos Michael | $345,000 | -- |
Source: Public Records
Mortgage History
| Date | Status | Borrower | Loan Amount |
|---|---|---|---|
| Open | Lenoach Jean Claude | $330,000 | |
| Closed | Lenoach Jean Claude | $330,000 | |
| Previous Owner | Theologos Michael | $185,000 |
Source: Public Records
Tax History Compared to Growth
Tax History
| Year | Tax Paid | Tax Assessment Tax Assessment Total Assessment is a certain percentage of the fair market value that is determined by local assessors to be the total taxable value of land and additions on the property. | Land | Improvement |
|---|---|---|---|---|
| 2025 | $7,520 | $60,148 | $6,853 | $53,295 |
| 2024 | $7,520 | $60,148 | $7,318 | $52,830 |
| 2023 | $7,269 | $58,145 | $8,509 | $49,636 |
| 2022 | $5,340 | $58,894 | $8,489 | $50,405 |
| 2021 | $3,793 | $69,275 | $8,489 | $60,786 |
| 2020 | $2,484 | $71,450 | $8,489 | $62,961 |
| 2019 | $1,404 | $59,566 | $8,489 | $51,077 |
| 2018 | $298 | $44,832 | $7,667 | $37,165 |
| 2017 | $298 | $41,512 | $7,526 | $33,986 |
| 2016 | $302 | $41,512 | $7,526 | $33,986 |
| 2015 | $236 | $35,591 | $6,681 | $28,910 |
| 2014 | $236 | $35,591 | $6,767 | $28,824 |
Source: Public Records
Map
Nearby Homes
- 25-63 38th St Unit 1A
- 2569 38th St Unit 1R
- 25-64 38th St
- 24-75 38th St Unit A1
- 24-75 38th St Unit 5C
- 24-75 38th St Unit C9
- 24-75 38th St Unit A10
- 24-75 38th St Unit D7/D8
- 25-54 37th St
- 2590 37th St
- 24-65 38 St Unit D10
- 24-65 38th St Unit D4
- 24-65 38th St Unit A5
- 24-51 38th St Unit B7
- 2451 38th St Unit 7B
- 25-34 42nd St
- 25-14 43rd St
- 25-68 34th St
- 25 W 28th St Unit PH 42 B
- 25 W 28th St Unit 41D
- 2569 38th St Unit CF
- 2569 38th St Unit 4R
- 2569 38th St Unit 4F
- 2569 38th St Unit 3R
- 2569 38th St Unit 2R
- 2569 38th St Unit 2F
- 2569 38th St
- 25-69 38 Th St Unit 4 F
- 25-69 38 Th St Unit 2-F
- 25-69 38th St Unit 3F
- 25-69 38th St Unit 4R
- 25-69 38th St Unit 1B
- 25-69 38th St
- 25-69 38th St Unit 2R
- 25-69 38th St Unit 2F
- 2569 38th St Unit 3F
- 25-69 38th St Unit 4F
- 2567 38th St
- 2573 38th St
- 25-67 38th St Unit 5A