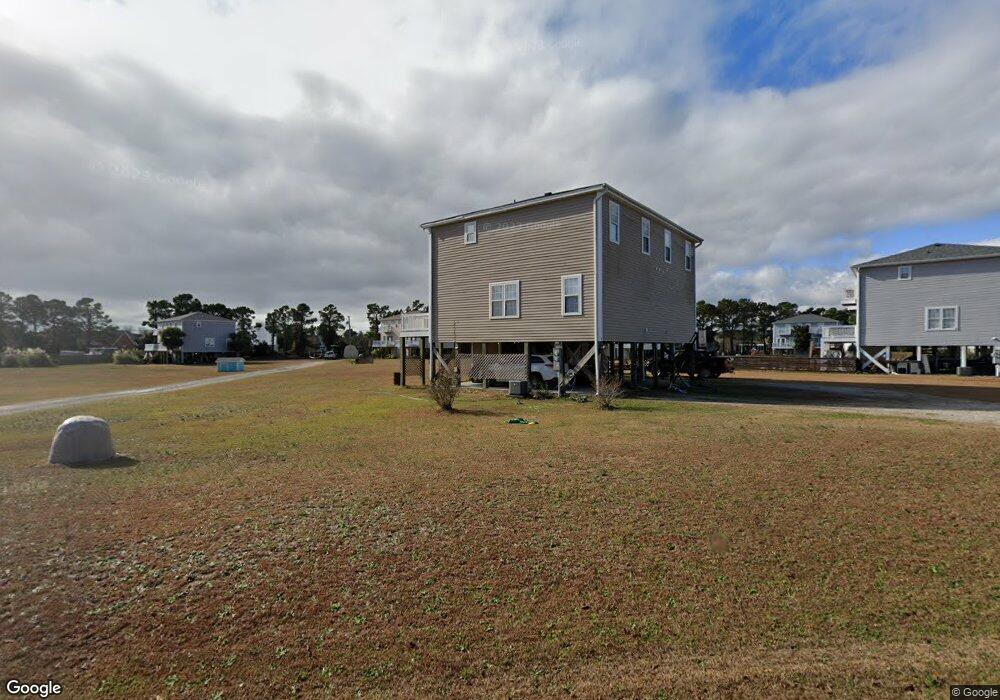
256B Twin Oaks Dr Hampstead, NC 28443
Estimated Value: $297,000 - $336,000
3
Beds
2
Baths
1,320
Sq Ft
$236/Sq Ft
Est. Value
About This Home
This home is located at 256B Twin Oaks Dr, Hampstead, NC 28443 and is currently estimated at $311,491, approximately $235 per square foot. 256B Twin Oaks Dr is a home located in Pender County with nearby schools including North Topsail Elementary School, Topsail Middle School, and Topsail High School.
Ownership History
Date
Name
Owned For
Owner Type
Purchase Details
Closed on
Apr 24, 2006
Sold by
Castellano Anthony J and Castellano Rose
Bought by
Ianno Christopher P and Ianno Laura A
Current Estimated Value
Home Financials for this Owner
Home Financials are based on the most recent Mortgage that was taken out on this home.
Original Mortgage
$110,000
Outstanding Balance
$61,619
Interest Rate
6.31%
Mortgage Type
New Conventional
Estimated Equity
$249,872
Purchase Details
Closed on
Jun 7, 2005
Sold by
Castellano Perry J and Castellano Carole T
Bought by
Castellano Perry J and Castellano Carole T
Purchase Details
Closed on
Jan 31, 2005
Sold by
Zehringer Thomas J and Zehringer Kathryn A
Bought by
Castellano Perry J
Home Financials for this Owner
Home Financials are based on the most recent Mortgage that was taken out on this home.
Original Mortgage
$116,000
Interest Rate
1.37%
Mortgage Type
Adjustable Rate Mortgage/ARM
Create a Home Valuation Report for This Property
The Home Valuation Report is an in-depth analysis detailing your home's value as well as a comparison with similar homes in the area
Home Values in the Area
Average Home Value in this Area
Purchase History
| Date | Buyer | Sale Price | Title Company |
|---|---|---|---|
| Ianno Christopher P | $185,000 | -- | |
| Castellano Perry J | -- | -- | |
| Castellano Perry J | $145,000 | -- |
Source: Public Records
Mortgage History
| Date | Status | Borrower | Loan Amount |
|---|---|---|---|
| Open | Ianno Christopher P | $110,000 | |
| Previous Owner | Castellano Perry J | $116,000 |
Source: Public Records
Tax History
| Year | Tax Paid | Tax Assessment Tax Assessment Total Assessment is a certain percentage of the fair market value that is determined by local assessors to be the total taxable value of land and additions on the property. | Land | Improvement |
|---|---|---|---|---|
| 2025 | -- | $325,942 | $78,400 | $247,542 |
| 2024 | $1,344 | $123,703 | $5,000 | $118,703 |
| 2023 | $1,344 | $123,703 | $5,000 | $118,703 |
| 2022 | $1,140 | $123,703 | $5,000 | $118,703 |
| 2021 | $1,140 | $123,703 | $5,000 | $118,703 |
| 2020 | $1,250 | $123,703 | $5,000 | $118,703 |
| 2019 | $1,140 | $123,703 | $5,000 | $118,703 |
| 2018 | $1,014 | $91,015 | $4,050 | $86,965 |
| 2017 | $1,014 | $91,015 | $4,050 | $86,965 |
| 2016 | $895 | $91,015 | $4,050 | $86,965 |
| 2015 | $877 | $91,015 | $4,050 | $86,965 |
| 2014 | $782 | $91,015 | $4,050 | $86,965 |
| 2013 | -- | $91,015 | $4,050 | $86,965 |
| 2012 | -- | $91,015 | $4,050 | $86,965 |
Source: Public Records
Map
Nearby Homes
- Tract B Twin Oaks Dr
- Tract A Twin Oaks Dr
- 6 Oak View Ln
- 17 E Brenda Lee Dr
- 203 Moores Landing Ct
- 207 Moores Landing Rd
- Lot 46 Salt Marsh Ln
- 32 Salt Marsh Ln
- 114 Old Farm Rd
- 2689 Sloop Point Loop Rd
- 114 Cove Side Ln
- 154 Cotherstone Ct
- 101 Cottage Walk
- Lot 17 Redd Banks Ln
- 76 Solstice
- 38 Reston Bluff
- 151 Shelley Rd
- 328 Lookout Point
- 344 Lookout Point
- 59 Lookout Point
- 256 Twin Oaks Dr
- 256A Twin Oaks Dr
- 234B Twin Oaks Dr
- 234A Twin Oaks Dr
- 234 Twin Oaks Dr Unit A
- 234 Twin Oaks Dr
- 234 Twin Oaks Dr Unit B
- 234 Twin Oaks Dr Unit A And B
- 234 Twin Oaks Dr Unit A & B
- 0 Twin Oaks Dr
- 1 Twin Oaks Dr
- Lot 1 Twin Oaks Dr
- 290A Twin Oaks Dr
- 290B Twin Oaks Dr
- 253 Twin Oaks Dr
- 269 Twin Oaks Dr
- 235 Twin Oaks Dr
- 289 Twin Oaks Dr
- 270 Twin Oaks Dr Unit A
- 270 Twin Oaks Dr Unit B
Your Personal Tour Guide
Ask me questions while you tour the home.