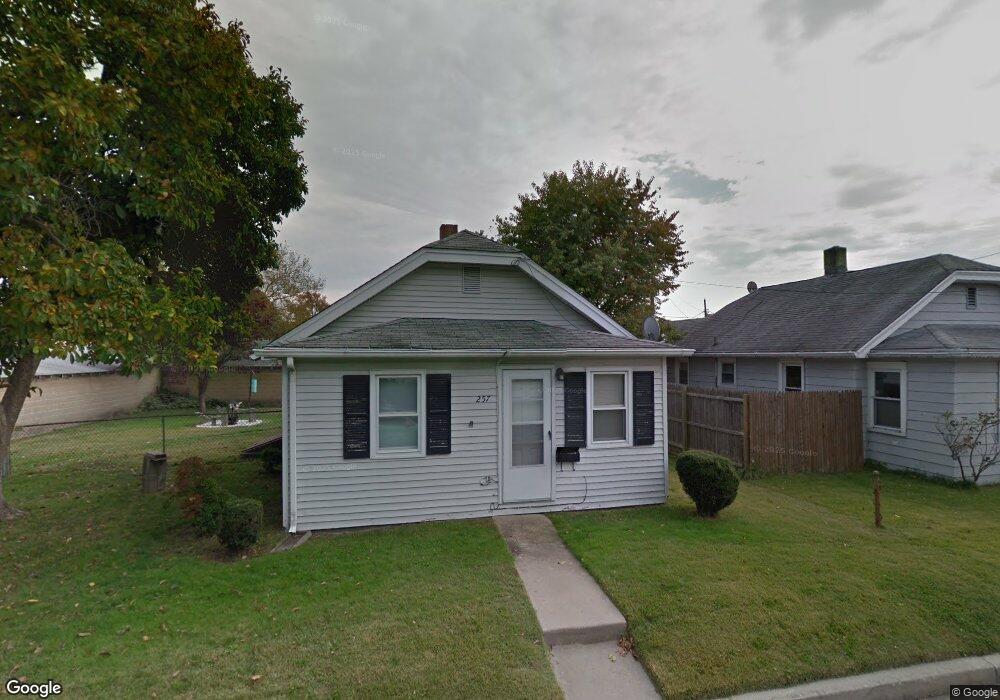
257 Birch St Penns Grove, NJ 08069
Estimated Value: $147,982 - $202,000
--
Bed
--
Bath
824
Sq Ft
$227/Sq Ft
Est. Value
About This Home
This home is located at 257 Birch St, Penns Grove, NJ 08069 and is currently estimated at $187,246, approximately $227 per square foot. 257 Birch St is a home located in Salem County with nearby schools including Lafayette-Pershing Elementary School, Paul W. Carleton Elementary School, and Field Street Elementary School.
Ownership History
Date
Name
Owned For
Owner Type
Purchase Details
Closed on
Aug 12, 1998
Sold by
Homeside Lending Inc
Bought by
Hud
Current Estimated Value
Purchase Details
Closed on
Mar 19, 1998
Sold by
Hud
Bought by
Beals Melvin R
Purchase Details
Closed on
Oct 2, 1997
Sold by
Mchugh James E and Mchugh Kathleen P
Bought by
Homeside Lending Inc
Purchase Details
Closed on
Sep 15, 1995
Sold by
Shough Sandra M
Bought by
Mchugh James E and Mchugh Kathleen P
Create a Home Valuation Report for This Property
The Home Valuation Report is an in-depth analysis detailing your home's value as well as a comparison with similar homes in the area
Home Values in the Area
Average Home Value in this Area
Purchase History
| Date | Buyer | Sale Price | Title Company |
|---|---|---|---|
| Hud | -- | Stewart Title Guaranty Compa | |
| Beals Melvin R | $39,088 | Intercoastal Title Agency In | |
| Homeside Lending Inc | -- | -- | |
| Mchugh James E | $59,900 | Congress Title Corp |
Source: Public Records
Tax History Compared to Growth
Tax History
| Year | Tax Paid | Tax Assessment Tax Assessment Total Assessment is a certain percentage of the fair market value that is determined by local assessors to be the total taxable value of land and additions on the property. | Land | Improvement |
|---|---|---|---|---|
| 2025 | $3,739 | $181,200 | $42,700 | $138,500 |
| 2024 | $3,610 | $101,400 | $34,200 | $67,200 |
| 2023 | $3,610 | $101,400 | $34,200 | $67,200 |
| 2022 | $3,397 | $101,400 | $34,200 | $67,200 |
| 2021 | $3,364 | $101,400 | $34,200 | $67,200 |
| 2020 | $3,394 | $101,400 | $34,200 | $67,200 |
| 2019 | $3,422 | $101,400 | $34,200 | $67,200 |
| 2018 | $3,171 | $100,700 | $45,400 | $55,300 |
| 2017 | $2,957 | $100,700 | $45,400 | $55,300 |
| 2016 | $2,849 | $100,700 | $45,400 | $55,300 |
| 2015 | $2,716 | $100,700 | $45,400 | $55,300 |
| 2014 | $2,571 | $100,700 | $45,400 | $55,300 |
Source: Public Records
Map
Nearby Homes