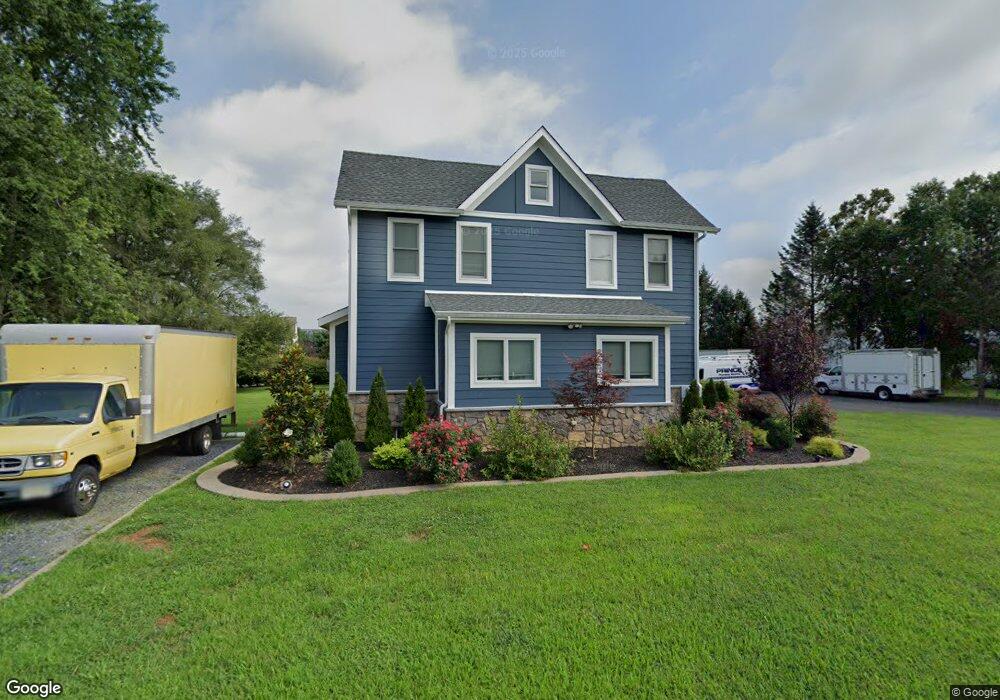
257 Conover Rd East Windsor, NJ 08520
Estimated Value: $544,000 - $912,000
3
Beds
2
Baths
2,025
Sq Ft
$364/Sq Ft
Est. Value
About This Home
This home is located at 257 Conover Rd, East Windsor, NJ 08520 and is currently estimated at $737,796, approximately $364 per square foot. 257 Conover Rd is a home located in Mercer County with nearby schools including Melvin H. Kreps Middle School, Hightstown High School, and SciCore Academy.
Ownership History
Date
Name
Owned For
Owner Type
Purchase Details
Closed on
Dec 28, 2017
Sold by
Ditillio Ralph and Ditillio Dorothy
Bought by
Prince Scott R and Prince Dina R
Current Estimated Value
Home Financials for this Owner
Home Financials are based on the most recent Mortgage that was taken out on this home.
Original Mortgage
$224,800
Outstanding Balance
$60,577
Interest Rate
3.92%
Mortgage Type
New Conventional
Estimated Equity
$677,219
Purchase Details
Closed on
Jan 5, 2005
Create a Home Valuation Report for This Property
The Home Valuation Report is an in-depth analysis detailing your home's value as well as a comparison with similar homes in the area
Home Values in the Area
Average Home Value in this Area
Purchase History
| Date | Buyer | Sale Price | Title Company |
|---|---|---|---|
| Prince Scott R | $281,000 | The New Choice Title Agency | |
| -- | -- | -- |
Source: Public Records
Mortgage History
| Date | Status | Borrower | Loan Amount |
|---|---|---|---|
| Open | Prince Scott R | $224,800 |
Source: Public Records
Tax History Compared to Growth
Tax History
| Year | Tax Paid | Tax Assessment Tax Assessment Total Assessment is a certain percentage of the fair market value that is determined by local assessors to be the total taxable value of land and additions on the property. | Land | Improvement |
|---|---|---|---|---|
| 2025 | $16,089 | $432,500 | $183,100 | $249,400 |
| 2024 | $15,233 | $432,500 | $183,100 | $249,400 |
| 2023 | $15,233 | $432,500 | $183,100 | $249,400 |
| 2022 | $14,839 | $432,500 | $183,100 | $249,400 |
| 2021 | $14,731 | $432,500 | $183,100 | $249,400 |
| 2020 | $14,748 | $432,500 | $183,100 | $249,400 |
| 2019 | $14,614 | $432,500 | $183,100 | $249,400 |
| 2018 | $14,424 | $432,500 | $183,100 | $249,400 |
| 2017 | $13,215 | $396,600 | $183,100 | $213,500 |
| 2016 | $13,028 | $396,600 | $183,100 | $213,500 |
| 2015 | $12,774 | $396,600 | $183,100 | $213,500 |
| 2014 | $12,624 | $396,600 | $183,100 | $213,500 |
Source: Public Records
Map
Nearby Homes
- 2 Carriage Ct
- 59 Moorsgate Cir
- 20 Stonehedge Dr
- 24 Stonehedge Dr
- 4 Wendover Rd
- 23 Fulham Way
- 785 Old York Rd
- 28 Columbia Ave
- 89 Hickory Corner Rd
- 648 Old York Rd
- 102 Teal Ct
- 569 Route 130
- 58 Teal Ct
- 17 Winchester Dr
- 108 Orchard Ave
- 107 Hausser Ave
- 302 S Main St
- 740 Windsor Perrineville
- 201 Morrison Ave
- 20 Beechcroft Dr