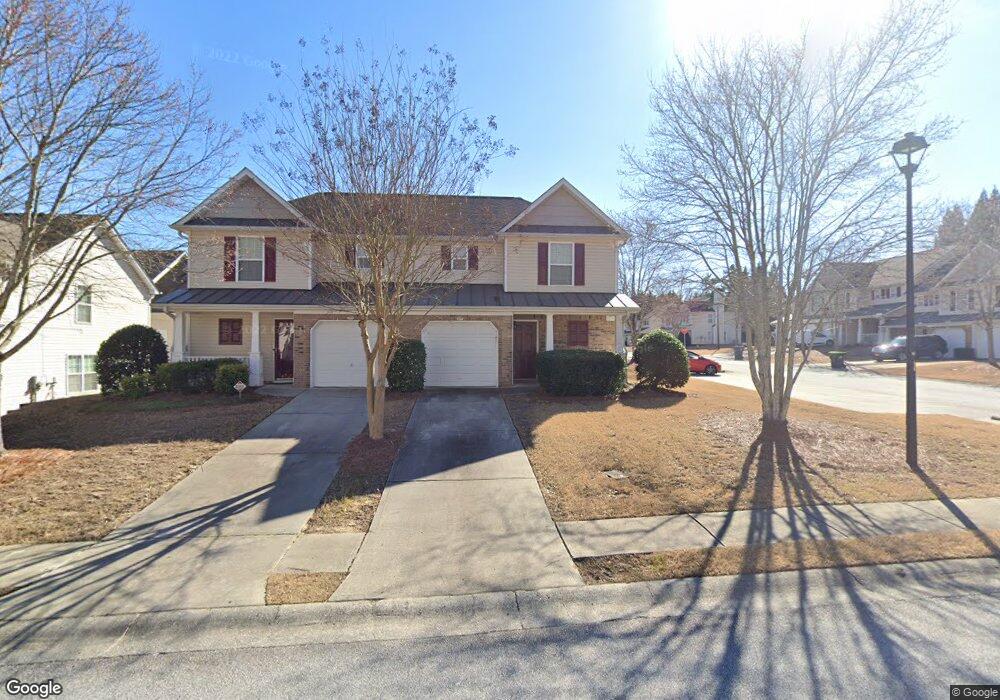
257 Darby's Crossing Ct Hiram, GA 30141
East Paulding County NeighborhoodEstimated Value: $225,000 - $244,000
2
Beds
2
Baths
1,090
Sq Ft
$214/Sq Ft
Est. Value
About This Home
This home is located at 257 Darby's Crossing Ct, Hiram, GA 30141 and is currently estimated at $233,008, approximately $213 per square foot. 257 Darby's Crossing Ct is a home located in Paulding County with nearby schools including Hiram Elementary School, P. B. Ritch Middle School, and East Paulding High School.
Ownership History
Date
Name
Owned For
Owner Type
Purchase Details
Closed on
Dec 8, 2017
Sold by
Horn David
Bought by
Oel Management Llc
Current Estimated Value
Purchase Details
Closed on
Apr 23, 2012
Sold by
Secretary Of Housing And U
Bought by
Horn David
Home Financials for this Owner
Home Financials are based on the most recent Mortgage that was taken out on this home.
Original Mortgage
$41,900
Interest Rate
4.37%
Mortgage Type
FHA
Purchase Details
Closed on
Dec 6, 2011
Sold by
Washington Carol A
Bought by
Everbank
Purchase Details
Closed on
Nov 22, 2005
Sold by
Mcbride & Son Homes Atlanta Ll
Bought by
Washington Carol A
Home Financials for this Owner
Home Financials are based on the most recent Mortgage that was taken out on this home.
Original Mortgage
$115,577
Interest Rate
6.1%
Mortgage Type
FHA
Purchase Details
Closed on
Oct 5, 2004
Sold by
West Hiram Development Inc
Bought by
Mcbride & Son Homes Atlanta Llc
Create a Home Valuation Report for This Property
The Home Valuation Report is an in-depth analysis detailing your home's value as well as a comparison with similar homes in the area
Home Values in the Area
Average Home Value in this Area
Purchase History
| Date | Buyer | Sale Price | Title Company |
|---|---|---|---|
| Oel Management Llc | $113,000 | -- | |
| Horn David | $42,150 | -- | |
| Everbank | $119,580 | -- | |
| Secretary Of Housing And Urban | $119,580 | -- | |
| Washington Carol A | $116,800 | -- | |
| Mcbride & Son Homes Atlanta Llc | $2,535,000 | -- |
Source: Public Records
Mortgage History
| Date | Status | Borrower | Loan Amount |
|---|---|---|---|
| Previous Owner | Horn David | $41,900 | |
| Previous Owner | Washington Carol A | $115,577 |
Source: Public Records
Tax History Compared to Growth
Tax History
| Year | Tax Paid | Tax Assessment Tax Assessment Total Assessment is a certain percentage of the fair market value that is determined by local assessors to be the total taxable value of land and additions on the property. | Land | Improvement |
|---|---|---|---|---|
| 2024 | $2,171 | $87,284 | $12,000 | $75,284 |
| 2023 | $2,311 | $88,652 | $12,000 | $76,652 |
| 2022 | $1,853 | $71,096 | $12,000 | $59,096 |
| 2021 | $1,497 | $51,524 | $6,000 | $45,524 |
| 2020 | $1,435 | $48,324 | $6,000 | $42,324 |
| 2019 | $1,380 | $45,808 | $6,000 | $39,808 |
| 2018 | $1,216 | $40,372 | $4,000 | $36,372 |
| 2017 | $1,069 | $36,860 | $4,000 | $32,860 |
| 2016 | $875 | $30,812 | $4,000 | $26,812 |
| 2015 | $795 | $27,688 | $4,000 | $23,688 |
| 2014 | $663 | $22,876 | $4,000 | $18,876 |
| 2013 | -- | $16,860 | $4,000 | $12,860 |
Source: Public Records
Map
Nearby Homes
- 109 Darbys Crossing Ct
- 184 Darbys Crossing Ct
- 0B Hiram Acworth Hwy
- 0C Hiram Acworth Hwy
- 80 Indian Lake Dr
- 3529 MacLand Rd
- 00 MacLand Rd
- 0 MacLand Rd Unit 10558702
- 3278 MacLand Rd
- 258 Cristy Dr
- Boylston Plan at Old Mill Preserve
- Kittridge Plan at Old Mill Preserve
- Pendula Plan at Old Mill Preserve
- Wellton Plan at Old Mill Preserve
- Anglewood Plan at Old Mill Preserve
- 507 Barnfield Way
- 517 Barnfield Way
- 1 Corley Cir
- 608 Barnfield Way
- 45 Waterloo Ct
- 257 Darbys Crossing Ct
- 255 Darbys Crossing Ct
- 255 Darbys Crossing Ct Unit 91
- 16 Darbys Crossing Point
- 245 Darby's Crossing Ct
- 14 Darbys Xing Point
- 245 Darbys Crossing
- 14 Darbys Crossing Point
- 14 Darbys Crossing Pte
- 131 Darbys Crossing Dr Unit 131
- 131 Darbys Crossing Dr
- 131 Darbys Crossing Dr
- 243 Darbys Crossing Ct
- 10 Darbys Crossing Point
- 31 Darbys Crossing Point
- 133 Darbys Crossing Dr
- 21 Darbys Crossing Point Unit 71
- 21 Darbys Crossing Point
- 19 Darbys Crossing Point
- 13 Darbys Crossing Point Unit 13