
Seller's Agent in 2025
Michael Williams
Selling North Georgia Realty
(706) 271-6549
9 in this area
24 Total Sales
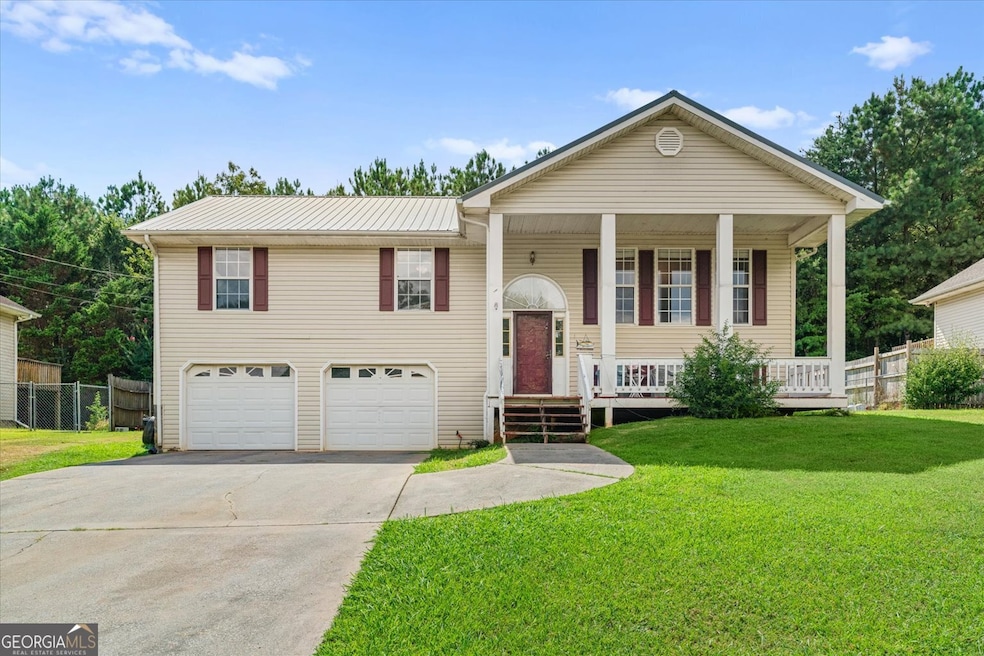
Welcome to 257 Diamond Way - a spacious 4-bedroom, 3-bath split-level home in beautiful Chatsworth, just minutes from scenic Fort Mountain. This inviting home features a large front porch and a cozy living room with a fireplace that flows into a kitchen with an island, stainless steel appliances, and rich wood cabinetry. A separate dining area sits just off the kitchen, making it ideal for entertaining. Upstairs, the primary suite includes an en-suite bathroom with a double vanity, along with two additional bedrooms and another full bath. All bedrooms are equipped with ceiling fans for added comfort. The finished basement includes a large bonus room, a full bathroom, and a laundry area-perfect for extra living space, guests, or a home office. Outside, enjoy a private backyard with a wooded area behind. A 2-car garage and access to sought-after Chatsworth City Schools complete the package.
Last Agent to Sell the Property
Selling North Georgia Realty License #344170 Listed on: 07/30/2025
| Date | Type | Sale Price | Title Company |
|---|---|---|---|
| Deed | $82,500 | -- | |
| Deed | -- | -- | |
| Deed | $112,500 | -- | |
| Deed | -- | -- | |
| Deed | $103,500 | -- | |
| Deed | $12,500 | -- | |
| Deed | -- | -- |
| Date | Status | Loan Amount | Loan Type |
|---|---|---|---|
| Open | $85,492 | New Conventional |
| Date | Event | Price | Change | Sq Ft Price |
|---|---|---|---|---|
| 09/11/2025 09/11/25 | Sold | $223,700 | -2.7% | $104 / Sq Ft |
| 08/19/2025 08/19/25 | Pending | -- | -- | -- |
| 07/30/2025 07/30/25 | For Sale | $230,000 | -- | $107 / Sq Ft |
| Year | Tax Paid | Tax Assessment Tax Assessment Total Assessment is a certain percentage of the fair market value that is determined by local assessors to be the total taxable value of land and additions on the property. | Land | Improvement |
|---|---|---|---|---|
| 2024 | $2,101 | $89,360 | $6,800 | $82,560 |
| 2023 | $2,202 | $89,520 | $6,800 | $82,720 |
| 2022 | $1,913 | $79,760 | $6,800 | $72,960 |
| 2021 | $1,659 | $67,440 | $6,800 | $60,640 |
| 2020 | $1,505 | $61,160 | $6,800 | $54,360 |
| 2019 | $1,336 | $53,960 | $6,800 | $47,160 |
| 2018 | $1,337 | $53,960 | $6,800 | $47,160 |
| 2017 | $0 | $47,240 | $6,800 | $40,440 |
| 2016 | $952 | $41,720 | $6,800 | $34,920 |
| 2015 | -- | $41,720 | $6,800 | $34,920 |
| 2014 | -- | $34,160 | $6,800 | $27,360 |
| 2013 | -- | $34,160 | $6,800 | $27,360 |
Seller's Agent in 2025
Michael Williams
Selling North Georgia Realty
(706) 271-6549
9 in this area
24 Total Sales
Seller Co-Listing Agent in 2025
Catherine Caswell Davis
Selling North Georgia Realty
(706) 280-8973
14 in this area
67 Total Sales
Buyer's Agent in 2025
Glenda Broker
Non-Mls Company
(800) 289-1214
Source: Georgia MLS
MLS Number: 10574532
APN: 0048C-170
Disclaimer: Certain information contained herein is derived from information provided by parties other than Homes.com. All information provided is deemed reliable, but is not guaranteed to be accurate and should be independently verified.
![]() The data relating to real estate for sale on this web site comes in part from the Broker Reciprocity Program of Georgia MLS. Real estate listings held by brokerage firms other than Redfin are marked with the Broker Reciprocity logo and detailed information about them includes the name of the listing brokers. Information deemed reliable but not guaranteed. Copyright 2025 Georgia MLS. All rights reserved.
The data relating to real estate for sale on this web site comes in part from the Broker Reciprocity Program of Georgia MLS. Real estate listings held by brokerage firms other than Redfin are marked with the Broker Reciprocity logo and detailed information about them includes the name of the listing brokers. Information deemed reliable but not guaranteed. Copyright 2025 Georgia MLS. All rights reserved.