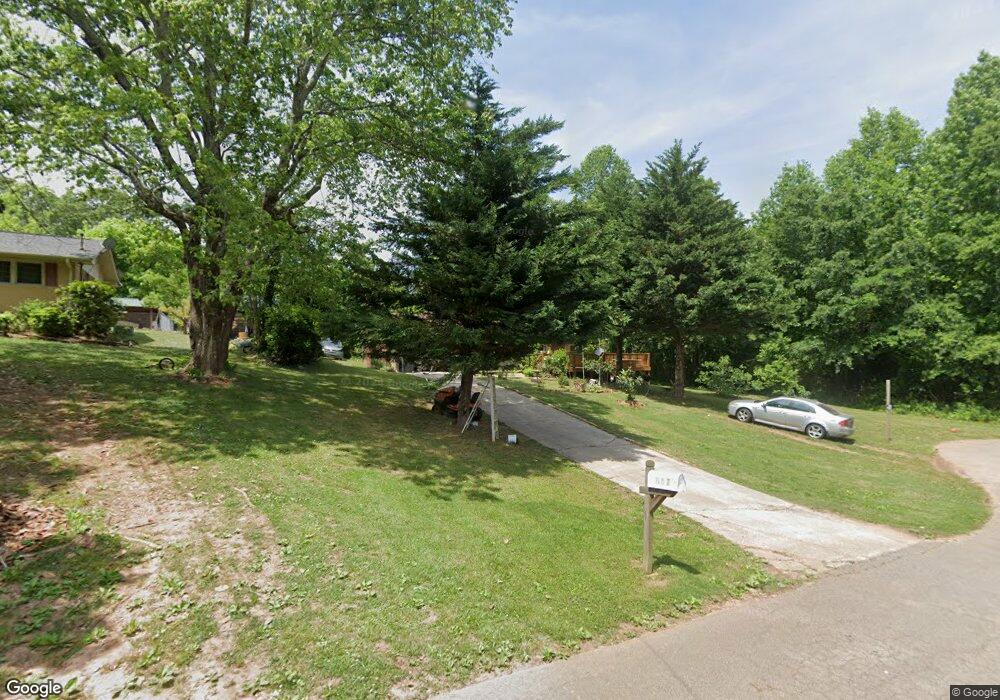
257 Linda Way Cornelia, GA 30531
Estimated Value: $248,000 - $293,000
3
Beds
2
Baths
1,404
Sq Ft
$187/Sq Ft
Est. Value
About This Home
This home is located at 257 Linda Way, Cornelia, GA 30531 and is currently estimated at $262,026, approximately $186 per square foot. 257 Linda Way is a home located in Habersham County with nearby schools including Cornelia Elementary School, Wilbanks Middle School, and Habersham Success Academy.
Ownership History
Date
Name
Owned For
Owner Type
Purchase Details
Closed on
May 1, 2006
Sold by
Not Provided
Bought by
Zavala Nolberto and Zavala Arcelia
Current Estimated Value
Home Financials for this Owner
Home Financials are based on the most recent Mortgage that was taken out on this home.
Original Mortgage
$97,500
Outstanding Balance
$56,436
Interest Rate
6.39%
Mortgage Type
New Conventional
Estimated Equity
$205,590
Purchase Details
Closed on
Aug 26, 2005
Sold by
Federal Home Loan Mortgage Corporation
Bought by
Zavala Nolberto and Zavala David
Home Financials for this Owner
Home Financials are based on the most recent Mortgage that was taken out on this home.
Original Mortgage
$100,000
Interest Rate
5.71%
Mortgage Type
New Conventional
Purchase Details
Closed on
Mar 1, 2005
Sold by
Wells Fargo Bank
Bought by
Federal Home Loan Mortgage Corporation
Create a Home Valuation Report for This Property
The Home Valuation Report is an in-depth analysis detailing your home's value as well as a comparison with similar homes in the area
Home Values in the Area
Average Home Value in this Area
Purchase History
| Date | Buyer | Sale Price | Title Company |
|---|---|---|---|
| Zavala Nolberto | -- | -- | |
| Zavala Nolberto | $87,500 | -- | |
| Federal Home Loan Mortgage Corporation | -- | -- | |
| Wells Fargo Bank | -- | -- |
Source: Public Records
Mortgage History
| Date | Status | Borrower | Loan Amount |
|---|---|---|---|
| Open | Zavala Nolberto | $97,500 | |
| Previous Owner | Zavala Nolberto | $100,000 |
Source: Public Records
Tax History Compared to Growth
Tax History
| Year | Tax Paid | Tax Assessment Tax Assessment Total Assessment is a certain percentage of the fair market value that is determined by local assessors to be the total taxable value of land and additions on the property. | Land | Improvement |
|---|---|---|---|---|
| 2025 | $2,499 | $98,679 | $15,720 | $82,959 |
| 2024 | -- | $84,436 | $9,360 | $75,076 |
| 2023 | $961 | $71,744 | $9,360 | $62,384 |
| 2022 | $1,328 | $61,264 | $7,488 | $53,776 |
| 2021 | $0 | $54,200 | $6,240 | $47,960 |
| 2020 | $1,040 | $41,796 | $6,240 | $35,556 |
| 2019 | $1,042 | $41,796 | $6,240 | $35,556 |
| 2018 | $1,034 | $41,796 | $6,240 | $35,556 |
| 2017 | $939 | $36,880 | $4,160 | $32,720 |
| 2016 | $909 | $92,200 | $4,160 | $32,720 |
| 2015 | -- | $92,200 | $4,160 | $32,720 |
| 2014 | $895 | $90,250 | $4,160 | $31,940 |
| 2013 | -- | $36,100 | $4,160 | $31,940 |
Source: Public Records
Map
Nearby Homes
- 115 Wood St
- 246 Burrell St
- 600 Hoyt St
- 113 Foster St NW
- 271 Modoc Dr
- 795 Wayside St
- 142 Galloway St
- 610 Level Grove Rd
- 952 Wayside St NW
- 167 South St
- 175 Hillcrest St
- 304 Magnolia Villas Dr
- 134 Hillcrest St
- 722 Pathway Cir
- 321 Magnolia Villas Dr
- 285 Magnolia Villas Dr
- 661 Forest Way
- 554 Creek Rd
- 486 Magnolia Grove Place
- 484 Magnolia Grove Place
- 227 Linda Way
- 254 Linda Way
- 223 Linda Way
- 224 Linda Way
- 197 Linda Way
- 650 Foster St
- 202 Linda Way
- 275 Wildwood Rd
- 275 Wildwood Rd Unit 13&14
- 173 Linda Way
- 176 Linda Way
- 322 Winddrift Ln
- 295 Crabapple Ln
- 295 Crabapple Ln
- 139 Linda Way
- 576 Foster St
- 252 Crabapple Ln
- 252 Crabapple Ln
- 131 Shady Ln
- 267 Wildwood Rd