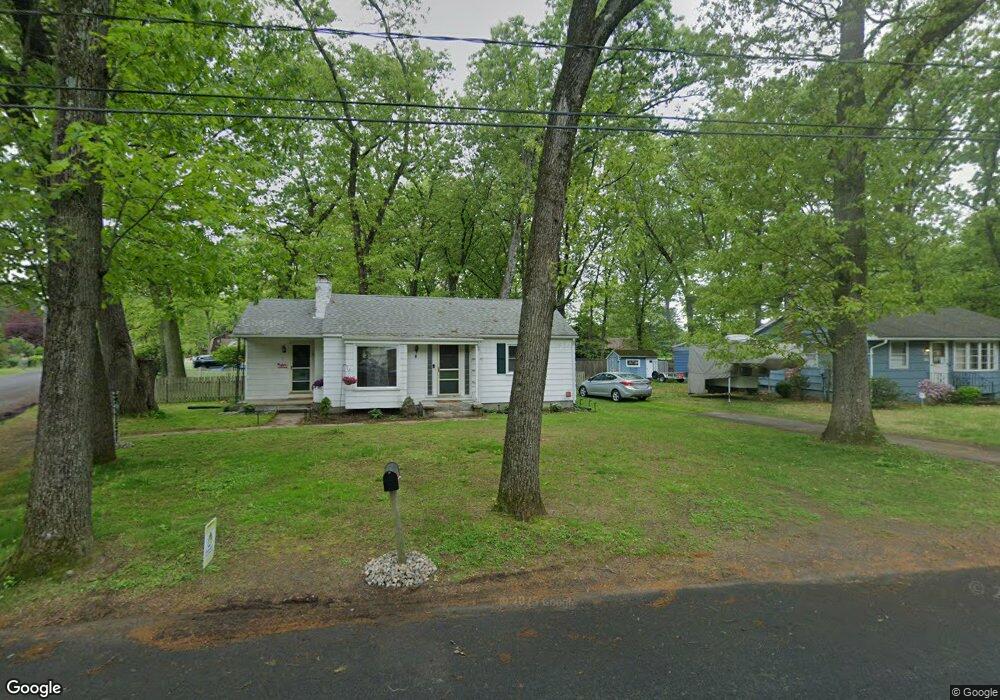
257 Maynard St Feeding Hills, MA 01030
Estimated Value: $280,000 - $306,000
2
Beds
1
Bath
933
Sq Ft
$311/Sq Ft
Est. Value
About This Home
This home is located at 257 Maynard St, Feeding Hills, MA 01030 and is currently estimated at $290,549, approximately $311 per square foot. 257 Maynard St is a home located in Hampden County with nearby schools including Agawam Junior High School, Agawam High School, and St Thomas The Apostle School.
Ownership History
Date
Name
Owned For
Owner Type
Purchase Details
Closed on
Nov 1, 1989
Sold by
Trench Elaine M
Bought by
Mcbridge Matthew A
Current Estimated Value
Home Financials for this Owner
Home Financials are based on the most recent Mortgage that was taken out on this home.
Original Mortgage
$81,750
Interest Rate
9.9%
Mortgage Type
Purchase Money Mortgage
Create a Home Valuation Report for This Property
The Home Valuation Report is an in-depth analysis detailing your home's value as well as a comparison with similar homes in the area
Home Values in the Area
Average Home Value in this Area
Purchase History
| Date | Buyer | Sale Price | Title Company |
|---|---|---|---|
| Mcbridge Matthew A | $109,000 | -- |
Source: Public Records
Mortgage History
| Date | Status | Borrower | Loan Amount |
|---|---|---|---|
| Open | Mcbridge Matthew A | $84,850 | |
| Closed | Mcbridge Matthew A | $81,750 |
Source: Public Records
Tax History Compared to Growth
Tax History
| Year | Tax Paid | Tax Assessment Tax Assessment Total Assessment is a certain percentage of the fair market value that is determined by local assessors to be the total taxable value of land and additions on the property. | Land | Improvement |
|---|---|---|---|---|
| 2025 | $3,562 | $243,300 | $102,500 | $140,800 |
| 2024 | $3,471 | $238,700 | $102,500 | $136,200 |
| 2023 | $3,178 | $201,400 | $88,800 | $112,600 |
| 2022 | $3,075 | $190,900 | $88,800 | $102,100 |
| 2021 | $2,844 | $169,300 | $78,100 | $91,200 |
| 2020 | $2,789 | $165,700 | $76,900 | $88,800 |
| 2019 | $2,702 | $162,300 | $75,400 | $86,900 |
| 2018 | $2,611 | $157,200 | $75,400 | $81,800 |
| 2017 | $2,482 | $152,200 | $75,400 | $76,800 |
| 2016 | $2,435 | $150,500 | $75,400 | $75,100 |
| 2015 | $2,315 | $147,100 | $75,400 | $71,700 |
Source: Public Records
Map
Nearby Homes
- 56 Taft St
- 468 Springfield St
- 335-337 Springfield St
- 416 Hillcrest Ave
- 258 Poplar Ave
- lot A North St
- 50 Howard St
- 36-38 Rowley St
- 66 Sheri Ln Unit 66
- 148 Craiwell Ave
- 19 Church St
- 25 Damato Way
- 64 Blairs Hill Rd
- 94 Witheridge St
- 36 Maple Terrace
- 42 Janet St
- 120 Hampden St
- 67 Colemore St
- 74 Maple Terrace
- 16 North St