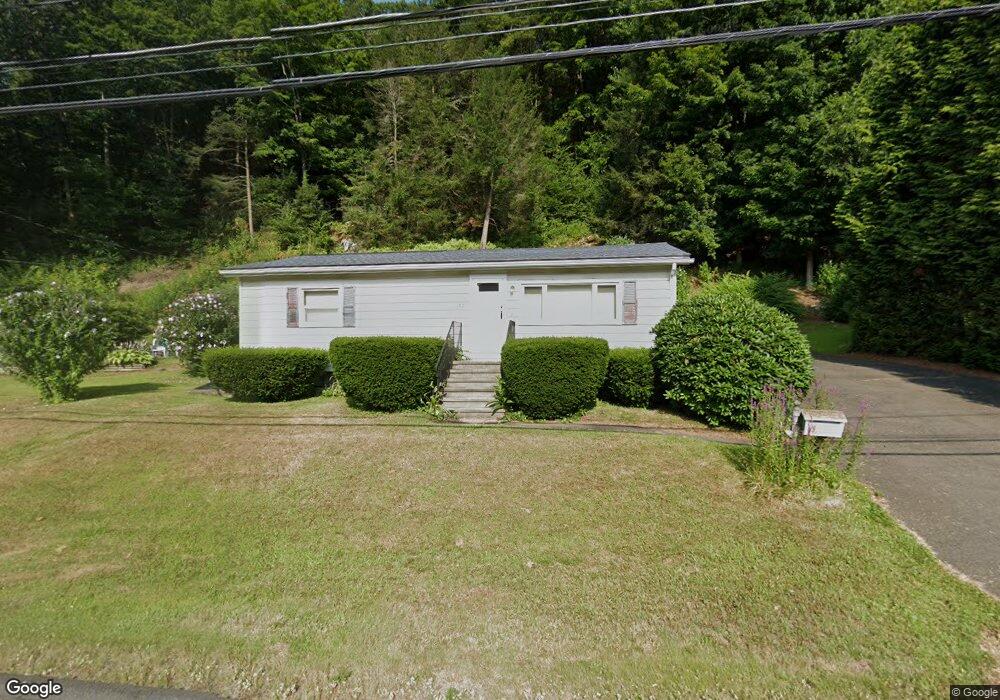
257 N Main St Thomaston, CT 06787
Estimated Value: $214,000 - $1,385,035
2
Beds
1
Bath
864
Sq Ft
$622/Sq Ft
Est. Value
About This Home
This home is located at 257 N Main St, Thomaston, CT 06787 and is currently estimated at $537,759, approximately $622 per square foot. 257 N Main St is a home located in Litchfield County with nearby schools including Black Rock School, Thomaston Center School, and Thomaston High School.
Ownership History
Date
Name
Owned For
Owner Type
Purchase Details
Closed on
Jun 30, 2022
Sold by
Young-Baron Ellen
Bought by
Masotti John W and Soos Michelle
Current Estimated Value
Home Financials for this Owner
Home Financials are based on the most recent Mortgage that was taken out on this home.
Original Mortgage
$825,000
Outstanding Balance
$782,670
Interest Rate
5.1%
Mortgage Type
Purchase Money Mortgage
Estimated Equity
-$244,911
Purchase Details
Closed on
Mar 22, 2010
Sold by
Lockhart Martha
Bought by
Lockhart David
Create a Home Valuation Report for This Property
The Home Valuation Report is an in-depth analysis detailing your home's value as well as a comparison with similar homes in the area
Home Values in the Area
Average Home Value in this Area
Purchase History
| Date | Buyer | Sale Price | Title Company |
|---|---|---|---|
| Masotti John W | $1,100,000 | None Available | |
| Masotti John W | $1,100,000 | None Available | |
| Lockhart David | -- | -- | |
| Lockhart David | -- | -- |
Source: Public Records
Mortgage History
| Date | Status | Borrower | Loan Amount |
|---|---|---|---|
| Open | Masotti John W | $825,000 | |
| Closed | Masotti John W | $825,000 | |
| Previous Owner | Lockhart David | $91,600 | |
| Previous Owner | Lockhart David | $88,000 |
Source: Public Records
Tax History Compared to Growth
Tax History
| Year | Tax Paid | Tax Assessment Tax Assessment Total Assessment is a certain percentage of the fair market value that is determined by local assessors to be the total taxable value of land and additions on the property. | Land | Improvement |
|---|---|---|---|---|
| 2025 | $3,898 | $108,850 | $50,470 | $58,380 |
| 2024 | $3,740 | $108,850 | $50,470 | $58,380 |
| 2023 | $3,661 | $108,850 | $50,470 | $58,380 |
| 2022 | $3,495 | $108,850 | $50,470 | $58,380 |
| 2021 | $3,480 | $96,320 | $50,470 | $45,850 |
| 2020 | $3,480 | $96,320 | $50,470 | $45,850 |
| 2019 | $3,519 | $96,320 | $50,470 | $45,850 |
| 2018 | $3,447 | $96,320 | $50,470 | $45,850 |
| 2017 | $3,376 | $96,320 | $50,470 | $45,850 |
| 2016 | $3,508 | $102,970 | $50,260 | $52,710 |
| 2015 | $3,463 | $102,970 | $50,260 | $52,710 |
| 2014 | $3,463 | $102,970 | $50,260 | $52,710 |
Source: Public Records
Map
Nearby Homes