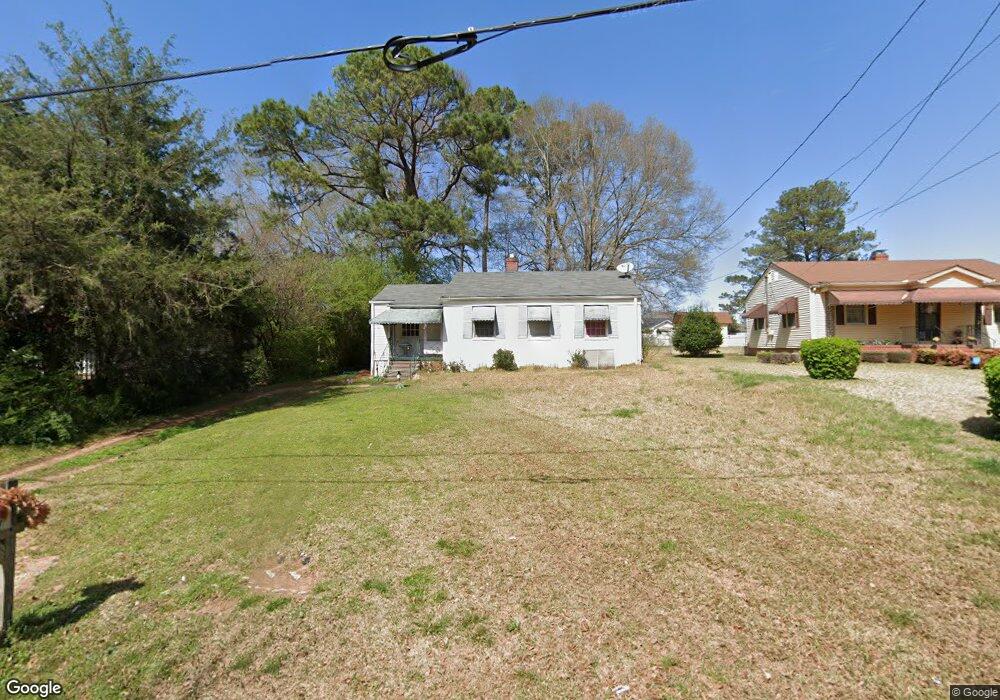
257 Rutland Cir Lagrange, GA 30241
Estimated Value: $92,000 - $151,000
2
Beds
1
Bath
929
Sq Ft
$126/Sq Ft
Est. Value
About This Home
This home is located at 257 Rutland Cir, Lagrange, GA 30241 and is currently estimated at $116,870, approximately $125 per square foot. 257 Rutland Cir is a home located in Troup County with nearby schools including Franklin Forest Elementary School, Hollis Hand Elementary School, and Ethel W. Kight Elementary School.
Ownership History
Date
Name
Owned For
Owner Type
Purchase Details
Closed on
Sep 23, 2022
Sold by
Thornton Alfred Morris
Bought by
Santiago Ruben
Current Estimated Value
Purchase Details
Closed on
May 20, 2019
Sold by
Langford Timothy W
Bought by
Thornton Alfred Morris
Purchase Details
Closed on
Oct 13, 2006
Sold by
Brooks John W
Bought by
Langford Timothy W
Home Financials for this Owner
Home Financials are based on the most recent Mortgage that was taken out on this home.
Original Mortgage
$61,928
Interest Rate
6.39%
Mortgage Type
New Conventional
Purchase Details
Closed on
Sep 27, 2001
Sold by
Raymond Lewis Davis
Bought by
Wendy John W and Wendy Brooks
Purchase Details
Closed on
Aug 21, 2001
Sold by
Mary M Davis Exec
Bought by
Raymond Lewis Davis
Purchase Details
Closed on
Sep 5, 1956
Sold by
Weaver Edward
Bought by
Mary M Davis Exec
Create a Home Valuation Report for This Property
The Home Valuation Report is an in-depth analysis detailing your home's value as well as a comparison with similar homes in the area
Home Values in the Area
Average Home Value in this Area
Purchase History
| Date | Buyer | Sale Price | Title Company |
|---|---|---|---|
| Santiago Ruben | $80,000 | -- | |
| Thornton Alfred Morris | $59,000 | -- | |
| Langford Timothy W | $62,900 | -- | |
| Langford Timothy W | $62,900 | -- | |
| Wendy John W | $37,000 | -- | |
| Raymond Lewis Davis | -- | -- | |
| Mary M Davis Exec | -- | -- |
Source: Public Records
Mortgage History
| Date | Status | Borrower | Loan Amount |
|---|---|---|---|
| Previous Owner | Langford Timothy W | $61,928 |
Source: Public Records
Tax History Compared to Growth
Tax History
| Year | Tax Paid | Tax Assessment Tax Assessment Total Assessment is a certain percentage of the fair market value that is determined by local assessors to be the total taxable value of land and additions on the property. | Land | Improvement |
|---|---|---|---|---|
| 2024 | $748 | $35,240 | $8,000 | $27,240 |
| 2023 | $660 | $32,360 | $6,280 | $26,080 |
| 2022 | $862 | $30,880 | $6,280 | $24,600 |
| 2021 | $723 | $23,960 | $6,280 | $17,680 |
| 2020 | $712 | $23,960 | $6,280 | $17,680 |
| 2019 | $549 | $18,192 | $5,672 | $12,520 |
| 2018 | $549 | $18,192 | $5,672 | $12,520 |
| 2017 | $549 | $18,192 | $5,672 | $12,520 |
| 2016 | $537 | $17,802 | $5,672 | $12,130 |
| 2015 | $538 | $17,802 | $5,672 | $12,130 |
| 2014 | $519 | $17,163 | $5,672 | $11,491 |
| 2013 | -- | $18,075 | $5,672 | $12,403 |
Source: Public Records
Map
Nearby Homes
- 210 Hearthstone Dr
- 130 Clara Jean Ct
- 121 Ct
- 305 Lenox Cir
- 226 Lenox Cir
- 105 Lenox Cir
- 101 Lenox Cir
- 618 S Harlem Cir
- 5 Curran Ave
- 616 S Harlem Cir
- 0 N Barnard Ave
- 706 N Harlem Cir
- 608 S Harlem Cir
- 606 S Harlem Cir
- 600 S Harlem Cir
- 131 Foch St
- 121 de Groat St
- 906 Georgia Ave
- 902 Georgia Ave
- 109 Dogwood Dr
- 259 Rutland Cir
- 255 Rutland Cir
- 253 Rutland Cir
- 261 Rutland Cir
- 111 Bonaventure Dr
- 109 Bonaventure Dr
- 234 Rutland Cir
- 113 Bonaventure Dr
- 107 Bonaventure Dr
- 232 Rutland Cir
- 251 Rutland Cir
- 263 Rutland Cir
- 263 Rutland Cir Unit 14
- 115 Bonaventure Dr
- 249 Rutland Cir
- 230 Rutland Cir Unit 6
- 230 Rutland Cir
- 265 Rutland Cir
- 236 Rutland Cir
- 247 Rutland Cir