Estimated Value: $383,000 - $394,000
4
Beds
1
Bath
988
Sq Ft
$395/Sq Ft
Est. Value
About This Home
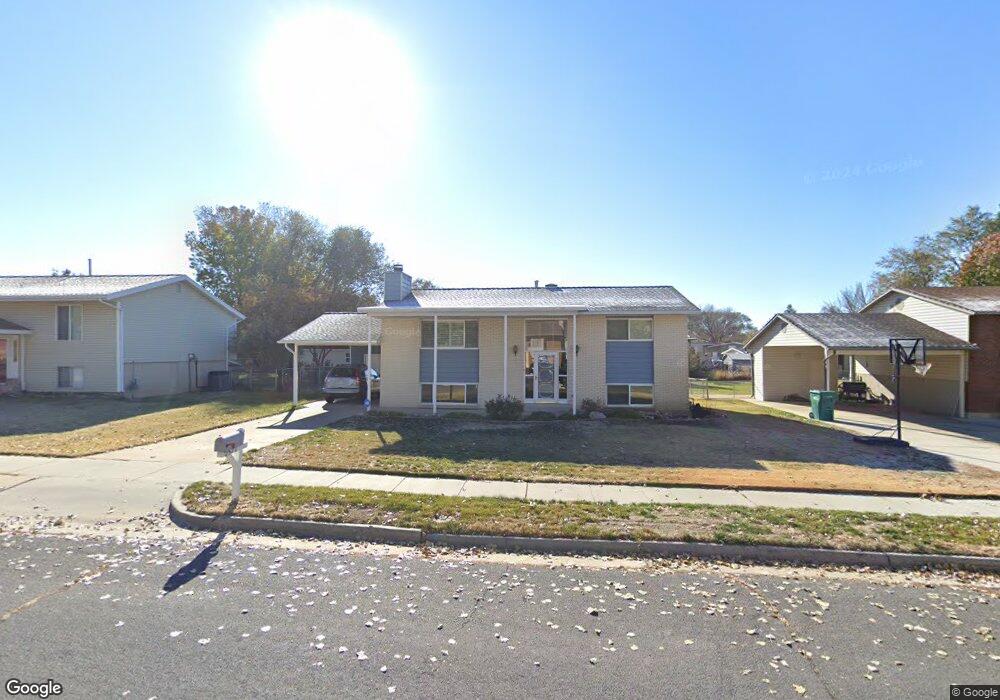
This home is located at 2571 W 6075 S, Roy, UT 84067 and is currently estimated at $390,433, approximately $395 per square foot. 2571 W 6075 S is a home located in Weber County with nearby schools including Municipal School, Roy Junior High School, and Roy High School.
Ownership History
Date
Name
Owned For
Owner Type
Purchase Details
Closed on
Jun 1, 2005
Sold by
Abeyta Henrietta L
Bought by
Abeyta Henrietta L
Current Estimated Value
Purchase Details
Closed on
Sep 3, 1999
Sold by
Abeyta Henrietta L and Olson Henrietta L
Bought by
Abeyta Henrietta L
Purchase Details
Closed on
Mar 30, 1989
Sold by
Ifco
Bought by
Abeyta Henrietta L
Home Financials for this Owner
Home Financials are based on the most recent Mortgage that was taken out on this home.
Original Mortgage
$31,632
Interest Rate
7.56%
Mortgage Type
Seller Take Back
Purchase Details
Closed on
May 31, 1978
Sold by
Andrews John K and Andrews Claudia J
Bought by
Olson Chris H and Olson Henrietta L
Purchase Details
Closed on
Aug 8, 1976
Sold by
Butler Alma S
Bought by
Andrews John K and Andrews Claudia J
Create a Home Valuation Report for This Property
The Home Valuation Report is an in-depth analysis detailing your home's value as well as a comparison with similar homes in the area
Home Values in the Area
Average Home Value in this Area
Purchase History
| Date | Buyer | Sale Price | Title Company |
|---|---|---|---|
| Abeyta Henrietta L | -- | -- | |
| Abeyta Henrietta L | -- | -- | |
| Abeyta Henrietta L | -- | -- | |
| Olson Chris H | -- | -- | |
| Andrews John K | -- | -- |
Source: Public Records
Mortgage History
| Date | Status | Borrower | Loan Amount |
|---|---|---|---|
| Previous Owner | Abeyta Henrietta L | $31,632 |
Source: Public Records
Tax History Compared to Growth
Tax History
| Year | Tax Paid | Tax Assessment Tax Assessment Total Assessment is a certain percentage of the fair market value that is determined by local assessors to be the total taxable value of land and additions on the property. | Land | Improvement |
|---|---|---|---|---|
| 2025 | $2,514 | $396,698 | $125,233 | $271,465 |
| 2024 | $2,319 | $201,299 | $68,878 | $132,421 |
| 2023 | $2,178 | $188,650 | $67,156 | $121,494 |
| 2022 | $2,324 | $209,000 | $59,493 | $149,507 |
| 2021 | $1,883 | $277,000 | $77,323 | $199,677 |
| 2020 | $1,815 | $246,000 | $77,323 | $168,677 |
| 2019 | $1,708 | $217,000 | $46,848 | $170,152 |
| 2018 | $1,559 | $185,000 | $41,829 | $143,171 |
| 2017 | $1,517 | $169,000 | $38,837 | $130,163 |
| 2016 | $1,373 | $81,380 | $17,131 | $64,249 |
| 2015 | $1,212 | $72,634 | $17,131 | $55,503 |
| 2014 | $1,222 | $72,634 | $17,131 | $55,503 |
Source: Public Records
Map
Nearby Homes