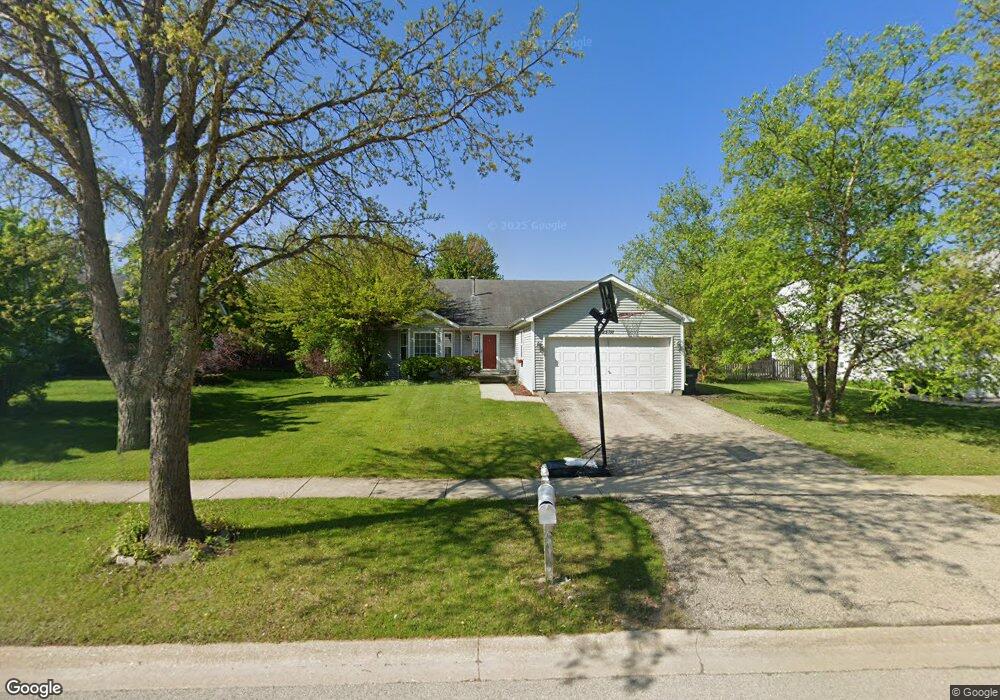
25711 S Cobblestone Ln Unit 8 Channahon, IL 60410
South DuPage River NeighborhoodEstimated Value: $262,998 - $367,000
4
Beds
--
Bath
1,450
Sq Ft
$233/Sq Ft
Est. Value
About This Home
This home is located at 25711 S Cobblestone Ln Unit 8, Channahon, IL 60410 and is currently estimated at $337,500, approximately $232 per square foot. 25711 S Cobblestone Ln Unit 8 is a home located in Will County with nearby schools including N B Galloway Elementary School, Pioneer Path School, and Three Rivers School.
Ownership History
Date
Name
Owned For
Owner Type
Purchase Details
Closed on
Jun 13, 2014
Sold by
Grey George and Grey Carolyn
Bought by
Grey George
Current Estimated Value
Purchase Details
Closed on
Sep 30, 2004
Sold by
Elliott Carl P and Elliott Amy L
Bought by
Grey Carolyn A
Home Financials for this Owner
Home Financials are based on the most recent Mortgage that was taken out on this home.
Original Mortgage
$165,600
Outstanding Balance
$80,525
Interest Rate
5.5%
Mortgage Type
New Conventional
Estimated Equity
$256,975
Purchase Details
Closed on
Apr 19, 2000
Sold by
Citizens First National Bank Princeton
Bought by
Elliott Carl P
Home Financials for this Owner
Home Financials are based on the most recent Mortgage that was taken out on this home.
Original Mortgage
$155,092
Interest Rate
8.24%
Mortgage Type
FHA
Create a Home Valuation Report for This Property
The Home Valuation Report is an in-depth analysis detailing your home's value as well as a comparison with similar homes in the area
Home Values in the Area
Average Home Value in this Area
Purchase History
| Date | Buyer | Sale Price | Title Company |
|---|---|---|---|
| Grey George | -- | None Available | |
| Grey Carolyn A | $207,000 | Lawyers | |
| Elliott Carl P | $150,000 | -- |
Source: Public Records
Mortgage History
| Date | Status | Borrower | Loan Amount |
|---|---|---|---|
| Open | Grey Carolyn A | $165,600 | |
| Previous Owner | Elliott Carl P | $155,092 | |
| Closed | Grey Carolyn A | $31,050 |
Source: Public Records
Tax History Compared to Growth
Tax History
| Year | Tax Paid | Tax Assessment Tax Assessment Total Assessment is a certain percentage of the fair market value that is determined by local assessors to be the total taxable value of land and additions on the property. | Land | Improvement |
|---|---|---|---|---|
| 2024 | $5,390 | $71,914 | $20,668 | $51,246 |
| 2023 | $5,390 | $78,000 | $18,234 | $59,766 |
| 2022 | $5,169 | $66,089 | $17,103 | $48,986 |
| 2021 | $4,825 | $62,466 | $16,165 | $46,301 |
| 2020 | $4,675 | $61,121 | $15,817 | $45,304 |
| 2019 | $4,108 | $54,400 | $15,100 | $39,300 |
| 2018 | $3,589 | $48,083 | $14,185 | $33,898 |
| 2017 | $3,412 | $45,159 | $13,598 | $31,561 |
| 2016 | $3,296 | $43,339 | $13,050 | $30,289 |
| 2015 | $2,824 | $40,200 | $12,050 | $28,150 |
| 2014 | $2,824 | $38,650 | $11,700 | $26,950 |
| 2013 | $2,824 | $38,650 | $11,700 | $26,950 |
Source: Public Records
Map
Nearby Homes
- 25719 S Cobblestone Ln
- 25815 S Bell Rd
- 25632 S Fieldstone Ct
- 25624 S Fieldstone Ct
- 26436 W Spur Ct
- 26518 W Deer Path
- 26201 W Winding Oak Ct Unit 11
- 26210 W Bayberry Ct Unit 12
- 25710 S Parkside Dr
- 26305 W Ravine Woods Dr
- 25610 S Parkside Dr
- 26832 W Hemlock Rd
- 26330 S Settlers Dr
- 26340 S Settlers Dr
- 26020 W Ravine Woods Dr
- Lot 8-4 Orchid Ln Unit 4
- Lot 8-3 Orchid Ln Unit 3
- Lot 8-1 W Orchid Ln Unit 1
- Lot 8-2 Orchid Ln Unit 2
- Lot 156 S Settlers Dr
- 25715 S Cobblestone Ln
- 25709 S Cobblestone Ln
- 26247 Squire Ln
- 26243 Squire Ln
- 25705 S Cobblestone Ln
- 26255 Squire Ln
- 26233 Squire Ln
- 25708 S Cobblestone Ln
- 25712 S Cobblestone Ln
- 26221 Squire Ln Unit 10
- 26259 Squire Ln
- 25704 S Cobblestone Ln
- 25725 S Cobblestone Ln
- 25703 S Cobblestone Ln
- 25716 S Cobblestone Ln
- 26213 Squire Ln Unit 10
- 26265 Squire Ln
- 25720 S Cobblestone Ln
- 26205 Squire Ln Unit 10
- 25700 S Cobblestone Ln