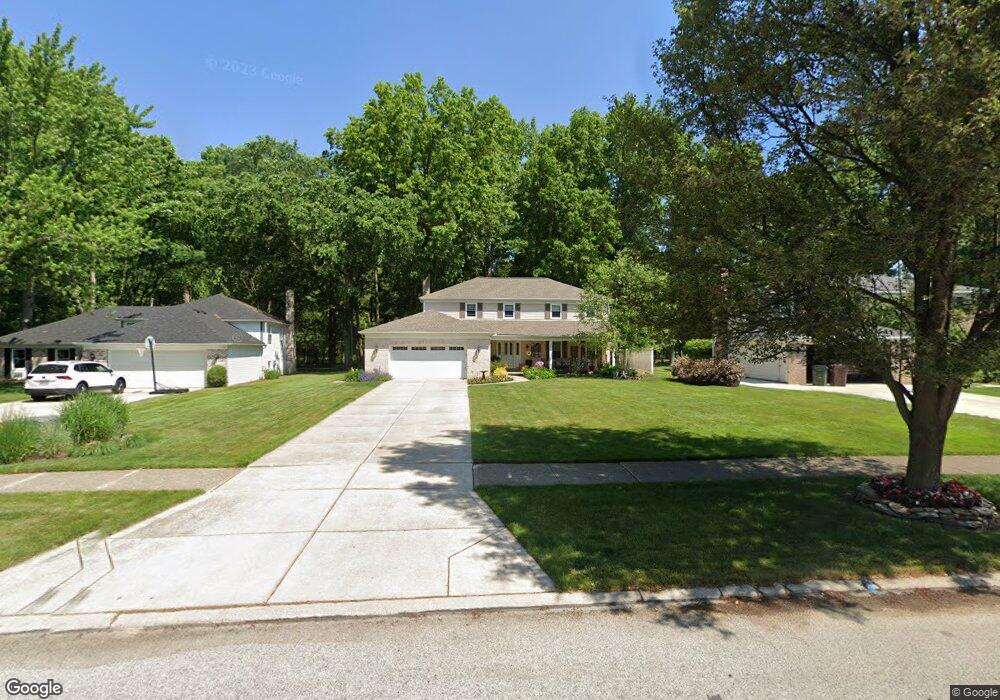
25712 Hidden Acres Dr Westlake, OH 44145
Estimated Value: $456,605 - $491,000
4
Beds
3
Baths
2,602
Sq Ft
$184/Sq Ft
Est. Value
About This Home
This home is located at 25712 Hidden Acres Dr, Westlake, OH 44145 and is currently estimated at $479,901, approximately $184 per square foot. 25712 Hidden Acres Dr is a home located in Cuyahoga County with nearby schools including Dover Intermediate School, Lee Burneson Middle School, and Westlake High School.
Ownership History
Date
Name
Owned For
Owner Type
Purchase Details
Closed on
Dec 26, 2006
Sold by
Kilbane Thomas J
Bought by
Kilbane Kathleen A
Current Estimated Value
Home Financials for this Owner
Home Financials are based on the most recent Mortgage that was taken out on this home.
Original Mortgage
$110,000
Interest Rate
6.27%
Mortgage Type
Unknown
Purchase Details
Closed on
Jun 26, 1990
Sold by
Robbins Jeffrey C and Robbins Wendy R
Bought by
Kilbane Thomas J
Purchase Details
Closed on
Dec 15, 1981
Sold by
Shafer Robert B
Bought by
Robbins Jeffrey C and Robbins Wendy R
Purchase Details
Closed on
Aug 5, 1977
Bought by
Shafer Robert B
Purchase Details
Closed on
Jan 18, 1977
Bought by
Park Place Development Inc
Purchase Details
Closed on
Jan 1, 1977
Bought by
Gibson Partners Inc
Create a Home Valuation Report for This Property
The Home Valuation Report is an in-depth analysis detailing your home's value as well as a comparison with similar homes in the area
Home Values in the Area
Average Home Value in this Area
Purchase History
| Date | Buyer | Sale Price | Title Company |
|---|---|---|---|
| Kilbane Kathleen A | -- | Attorney | |
| Kilbane Thomas J | $170,000 | -- | |
| Robbins Jeffrey C | $115,000 | -- | |
| Shafer Robert B | $75,000 | -- | |
| Park Place Development Inc | -- | -- | |
| Gibson Partners Inc | -- | -- |
Source: Public Records
Mortgage History
| Date | Status | Borrower | Loan Amount |
|---|---|---|---|
| Open | Kilbane Kathleen A | $150,500 | |
| Closed | Kilbane Kathleen A | $102,000 | |
| Closed | Kilbane Kathleen A | $110,000 | |
| Closed | Kilbane Kathleen A | $100,000 | |
| Previous Owner | Kilbane Thomas J | $75,000 | |
| Previous Owner | Kilbane Thomas J | $60,000 |
Source: Public Records
Tax History Compared to Growth
Tax History
| Year | Tax Paid | Tax Assessment Tax Assessment Total Assessment is a certain percentage of the fair market value that is determined by local assessors to be the total taxable value of land and additions on the property. | Land | Improvement |
|---|---|---|---|---|
| 2024 | $6,644 | $140,245 | $23,695 | $116,550 |
| 2023 | $5,629 | $101,580 | $21,180 | $80,400 |
| 2022 | $5,539 | $101,570 | $21,180 | $80,400 |
| 2021 | $5,546 | $101,570 | $21,180 | $80,400 |
| 2020 | $5,597 | $94,050 | $19,600 | $74,450 |
| 2019 | $5,427 | $268,700 | $56,000 | $212,700 |
| 2018 | $5,359 | $94,050 | $19,600 | $74,450 |
| 2017 | $5,324 | $86,390 | $17,610 | $68,780 |
| 2016 | $5,295 | $86,390 | $17,610 | $68,780 |
| 2015 | $5,237 | $86,390 | $17,610 | $68,780 |
| 2014 | $5,237 | $83,860 | $17,080 | $66,780 |
Source: Public Records
Map
Nearby Homes
- 25615 Hidden Acres Dr
- 25716 Westwood Rd
- 25715 Westwood Rd
- 2549 Canterbury Rd
- 2186 Canterbury Rd
- 2750 Canterbury Rd
- 24500 Westwood Rd
- 24502 Cornerstone
- 26553 Hilliard Blvd
- 2021 King James Pkwy Unit 222
- 1930 King James Pkwy Unit 205
- 25360 Hall Dr
- 1851 King James Pkwy Unit 114
- 25324 Hall Dr
- 24757 Meadow Ln
- 24407 Westwood Rd
- 1931 King James Pkwy Unit 427
- 24363 Smith Ave
- 2965 Creekside Dr
- 25530 Hilliard Blvd
- 25698 Hidden Acres Dr
- 25740 Hidden Acres Dr
- 25684 Hidden Acres Dr
- 25754 Hidden Acres Dr
- 25697 Hidden Acres Dr
- 25725 W Hedgewood Dr
- 25733 Hidden Acres Dr
- 25711 Hidden Acres Dr
- 25683 Hidden Acres Dr
- 25747 Hidden Acres Dr
- 25766 Hidden Acres Dr
- 25766 Hidden Acres Dr Unit D
- 2465 Glen Valley Dr
- 25761 Hidden Acres Dr
- 25697 W Hedgewood Dr
- 25669 Hidden Acres Dr
- 25669 Hidden Acres Dr Unit D
- 2449 Glen Valley Dr
- 2390 W Hedgewood Dr
- 25644 Hidden Acres Dr