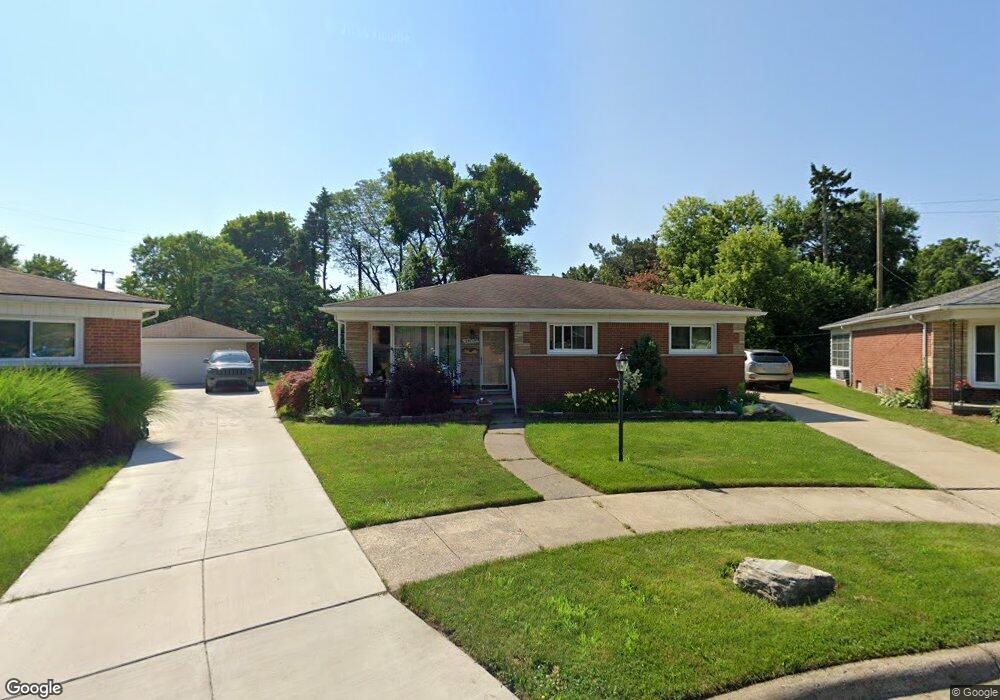
25715 Beech Ct Redford, MI 48239
Estimated Value: $221,751 - $291,000
--
Bed
1
Bath
1,287
Sq Ft
$187/Sq Ft
Est. Value
About This Home
This home is located at 25715 Beech Ct, Redford, MI 48239 and is currently estimated at $240,938, approximately $187 per square foot. 25715 Beech Ct is a home located in Wayne County with nearby schools including John D. Pierce Middle School, Lee M. Thurston High School, and Westfield Charter Academy.
Ownership History
Date
Name
Owned For
Owner Type
Purchase Details
Closed on
Mar 4, 2022
Sold by
Harrison and Pamela
Bought by
Harrison Pamela
Current Estimated Value
Home Financials for this Owner
Home Financials are based on the most recent Mortgage that was taken out on this home.
Original Mortgage
$126,000
Outstanding Balance
$101,464
Interest Rate
3.01%
Mortgage Type
New Conventional
Estimated Equity
$139,474
Purchase Details
Closed on
Jul 28, 2005
Sold by
Naibert Dean J
Bought by
Anderson Pamela
Purchase Details
Closed on
Jun 22, 2005
Sold by
Naibert Dean J
Bought by
National City Home Loan Services Inc
Purchase Details
Closed on
Aug 31, 2000
Sold by
Haney Carl E
Bought by
Naibert Dean J
Create a Home Valuation Report for This Property
The Home Valuation Report is an in-depth analysis detailing your home's value as well as a comparison with similar homes in the area
Home Values in the Area
Average Home Value in this Area
Purchase History
| Date | Buyer | Sale Price | Title Company |
|---|---|---|---|
| Harrison Pamela | -- | Dec Frank P | |
| Anderson Pamela | $164,900 | Multiple | |
| National City Home Loan Services Inc | $114,942 | -- | |
| Naibert Dean J | $141,500 | -- |
Source: Public Records
Mortgage History
| Date | Status | Borrower | Loan Amount |
|---|---|---|---|
| Open | Harrison Pamela | $126,000 |
Source: Public Records
Tax History Compared to Growth
Tax History
| Year | Tax Paid | Tax Assessment Tax Assessment Total Assessment is a certain percentage of the fair market value that is determined by local assessors to be the total taxable value of land and additions on the property. | Land | Improvement |
|---|---|---|---|---|
| 2025 | $861 | $102,100 | $0 | $0 |
| 2024 | $861 | $93,900 | $0 | $0 |
| 2023 | $825 | $83,700 | $0 | $0 |
| 2022 | $2,402 | $74,600 | $0 | $0 |
| 2021 | $2,334 | $70,800 | $0 | $0 |
| 2020 | $2,302 | $60,000 | $0 | $0 |
| 2019 | $2,252 | $53,700 | $0 | $0 |
| 2018 | $742 | $44,900 | $0 | $0 |
| 2017 | $2,568 | $42,300 | $0 | $0 |
| 2016 | $2,001 | $41,900 | $0 | $0 |
| 2015 | $3,117 | $38,200 | $0 | $0 |
| 2013 | $3,020 | $30,800 | $0 | $0 |
| 2012 | $1,889 | $33,900 | $8,400 | $25,500 |
Source: Public Records
Map
Nearby Homes