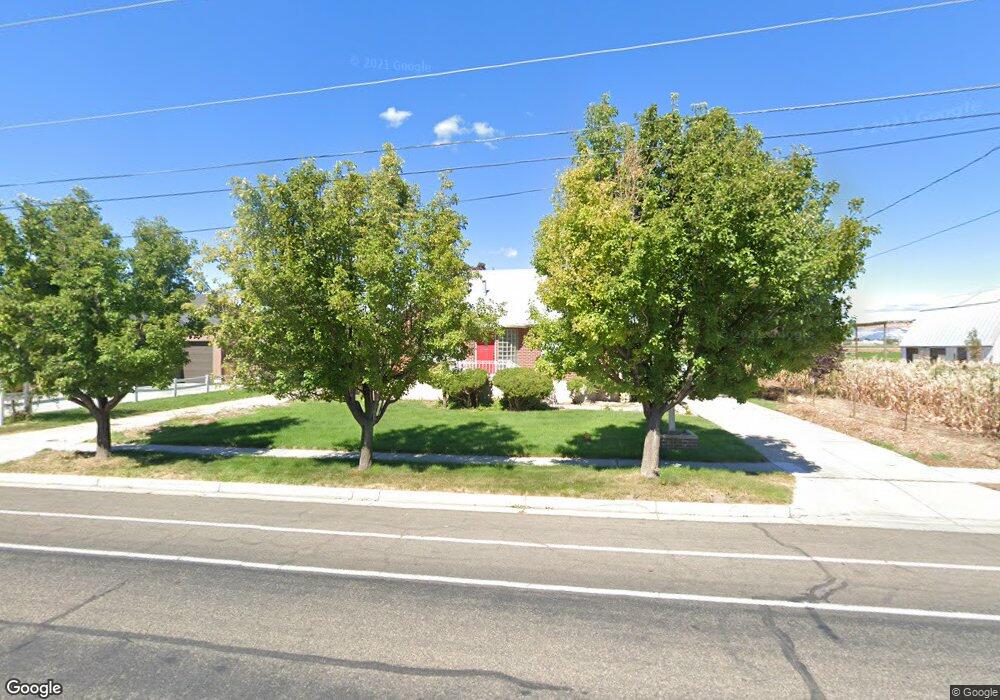
2572 W 700 S Syracuse, UT 84075
Estimated Value: $515,068 - $701,000
3
Beds
2
Baths
2,052
Sq Ft
$297/Sq Ft
Est. Value
About This Home
This home is located at 2572 W 700 S, Syracuse, UT 84075 and is currently estimated at $608,517, approximately $296 per square foot. 2572 W 700 S is a home located in Davis County with nearby schools including Syracuse Elementary School, Syracuse Junior High School, and Syracuse High School.
Ownership History
Date
Name
Owned For
Owner Type
Purchase Details
Closed on
Oct 19, 2020
Sold by
Gourley David
Bought by
Smooth Investments Llc
Current Estimated Value
Home Financials for this Owner
Home Financials are based on the most recent Mortgage that was taken out on this home.
Original Mortgage
$150,000
Outstanding Balance
$133,174
Interest Rate
2.8%
Mortgage Type
New Conventional
Estimated Equity
$475,343
Purchase Details
Closed on
Apr 6, 2018
Sold by
Mabey Patricia C
Bought by
Smotth Investments Llc
Home Financials for this Owner
Home Financials are based on the most recent Mortgage that was taken out on this home.
Original Mortgage
$150,000
Interest Rate
4.4%
Mortgage Type
New Conventional
Purchase Details
Closed on
Feb 26, 2014
Sold by
Mabey Patricia C
Bought by
Mabey Patricia C
Purchase Details
Closed on
Nov 3, 1998
Sold by
Cuthbert Elmer J and Cuthbert Gloria W
Bought by
Cuthbert Elmer J and Cuthbert Gloria W
Create a Home Valuation Report for This Property
The Home Valuation Report is an in-depth analysis detailing your home's value as well as a comparison with similar homes in the area
Home Values in the Area
Average Home Value in this Area
Purchase History
| Date | Buyer | Sale Price | Title Company |
|---|---|---|---|
| Smooth Investments Llc | -- | Vanguard Title Ins | |
| Gourley David | -- | Vanguard Title Ins | |
| Smotth Investments Llc | -- | Backman Title | |
| Mabey Patricia C | -- | None Available | |
| Cuthbert Elmer J | -- | -- |
Source: Public Records
Mortgage History
| Date | Status | Borrower | Loan Amount |
|---|---|---|---|
| Open | Gourley David | $150,000 | |
| Closed | Smooth Investments Llc | $150,000 | |
| Previous Owner | Smotth Investments Llc | $150,000 |
Source: Public Records
Tax History
| Year | Tax Paid | Tax Assessment Tax Assessment Total Assessment is a certain percentage of the fair market value that is determined by local assessors to be the total taxable value of land and additions on the property. | Land | Improvement |
|---|---|---|---|---|
| 2025 | $2,805 | $270,601 | $98,829 | $171,772 |
| 2024 | $2,724 | $264,549 | $80,662 | $183,887 |
| 2023 | $2,695 | $262,350 | $77,312 | $185,037 |
| 2022 | $2,914 | $514,000 | $147,455 | $366,545 |
| 2021 | $2,557 | $384,000 | $119,696 | $264,304 |
| 2020 | $2,304 | $335,000 | $104,968 | $230,032 |
| 2019 | $2,147 | $218,000 | $107,705 | $110,295 |
| 2018 | $1,945 | $199,000 | $103,421 | $95,579 |
| 2016 | $906 | $67,672 | $39,654 | $28,018 |
| 2015 | $1,468 | $104,445 | $39,654 | $64,791 |
| 2014 | $1,604 | $116,363 | $39,654 | $76,709 |
| 2013 | -- | $94,706 | $32,606 | $62,100 |
Source: Public Records
Map
Nearby Homes
- 2885 W 700 S
- 2098 W 700 S
- 2584 S 2430 St W Unit 502
- 2613 S 2430 W Unit 111
- 2614 S 2430 W Unit 106
- 2665 S 2430 W Unit 118
- 2663 S 2430 W
- 160 S 2775 W
- 4205 W 1100 S
- 2809 W 100 S
- 2935 W 1200 S
- 82 N 2875 W
- 114 N 2825 W
- 39 S 2000 W
- 1079 S 1875 W
- 1932 W 200 S
- 380 S 4300 W Unit 608
- 4200 W 800 N
- 12 N 2000 W Unit 1
- 12 N 2000 W Unit 2
Your Personal Tour Guide
Ask me questions while you tour the home.