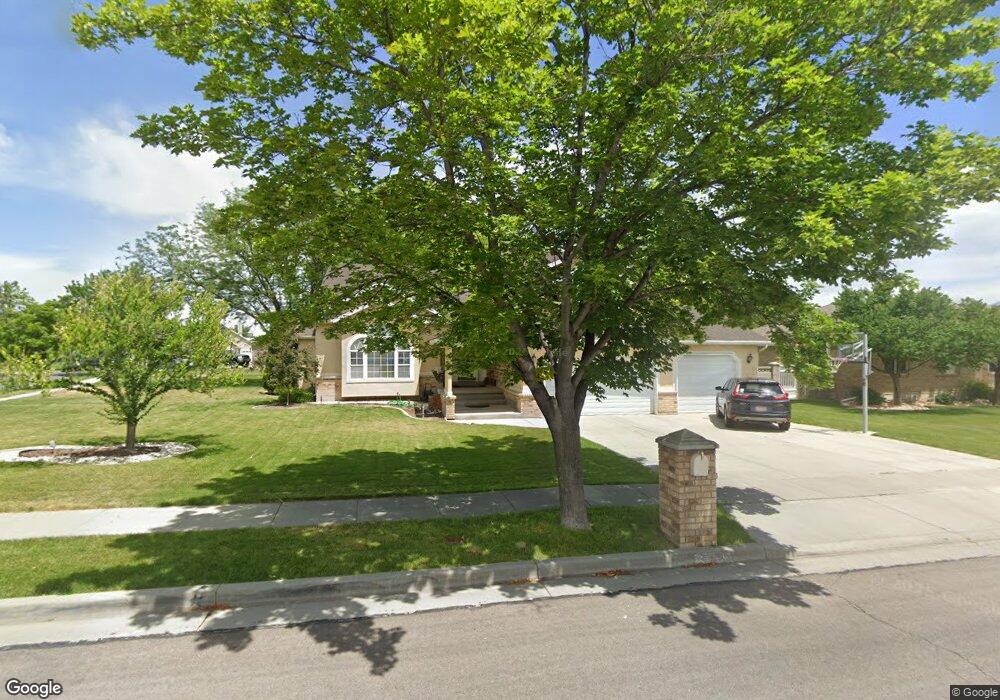
2572 Winding Way South Jordan, UT 84095
Estimated Value: $807,150 - $918,000
4
Beds
3
Baths
3,494
Sq Ft
$246/Sq Ft
Est. Value
About This Home
This home is located at 2572 Winding Way, South Jordan, UT 84095 and is currently estimated at $858,288, approximately $245 per square foot. 2572 Winding Way is a home located in Salt Lake County with nearby schools including Jordan Ridge School, South Jordan Middle School, and Hawthorn Academy.
Ownership History
Date
Name
Owned For
Owner Type
Purchase Details
Closed on
Mar 3, 2003
Sold by
Brown Steve B and Brown Jane H
Bought by
Brown Steven B and Brown Jane H
Current Estimated Value
Home Financials for this Owner
Home Financials are based on the most recent Mortgage that was taken out on this home.
Original Mortgage
$184,000
Interest Rate
5.28%
Purchase Details
Closed on
Oct 30, 1996
Sold by
Lemmon Roger D and Lemmon Joni L
Bought by
Brown Steve B and Brown Jane H
Home Financials for this Owner
Home Financials are based on the most recent Mortgage that was taken out on this home.
Original Mortgage
$171,900
Interest Rate
8.11%
Create a Home Valuation Report for This Property
The Home Valuation Report is an in-depth analysis detailing your home's value as well as a comparison with similar homes in the area
Home Values in the Area
Average Home Value in this Area
Purchase History
| Date | Buyer | Sale Price | Title Company |
|---|---|---|---|
| Brown Steven B | -- | Merrill Title | |
| Brown Steve B | -- | Old Republic Title Co Of Uta |
Source: Public Records
Mortgage History
| Date | Status | Borrower | Loan Amount |
|---|---|---|---|
| Closed | Brown Steven B | $184,000 | |
| Previous Owner | Brown Steve B | $171,900 |
Source: Public Records
Tax History Compared to Growth
Tax History
| Year | Tax Paid | Tax Assessment Tax Assessment Total Assessment is a certain percentage of the fair market value that is determined by local assessors to be the total taxable value of land and additions on the property. | Land | Improvement |
|---|---|---|---|---|
| 2025 | $3,766 | $758,000 | $304,900 | $453,100 |
| 2024 | $3,766 | $715,100 | $285,100 | $430,000 |
| 2023 | $3,828 | $685,800 | $279,500 | $406,300 |
| 2022 | $4,007 | $703,500 | $274,000 | $429,500 |
| 2021 | $3,345 | $538,900 | $224,700 | $314,200 |
| 2020 | $3,124 | $471,800 | $210,400 | $261,400 |
| 2019 | $3,034 | $450,300 | $210,400 | $239,900 |
| 2018 | $0 | $419,500 | $137,100 | $282,400 |
| 2017 | $2,732 | $395,400 | $137,100 | $258,300 |
| 2016 | $2,802 | $384,300 | $137,100 | $247,200 |
| 2015 | $2,564 | $341,900 | $150,100 | $191,800 |
| 2014 | $2,392 | $313,500 | $139,700 | $173,800 |
Source: Public Records
Map
Nearby Homes
- 2551 W Winding Way
- 2439 Bridle Oak Dr
- 2246 Country Bend Dr Unit 25
- 2375 Bonanza Way
- 2554 Cherry Grove Way
- 10320 S 2700 W
- 10177 Statesman Place
- 1558 W Banner Dr Unit 805
- 1574 W Banner Dr Unit 743
- 1556 W Banner Dr Unit 806
- 1548 W Banner Dr Unit 809
- 1552 W Banner Dr Unit 807
- 1553 W Banner Dr Unit 844
- 1967 W 9350 S
- 2343 Temple View Cir
- 1891 Orchard View Cir
- 9294 S 2700 W
- 10366 S 2200 W
- 9496 S 1930 W
- 2097 Jordan Villa Dr
- 2552 Winding Way
- 2667 Carriage Oak Ln
- 9847 S Country Bend Dr
- 2561 Country Bend Dr
- 2561 W Country Bend Dr
- 2604 Winding Way
- 2604 W Winding Way
- 2573 Winding Way
- 2593 Winding Way
- 2551 Winding Way
- 2541 W Country Bend Dr
- 2541 Country Bend Dr
- 2528 Winding Way
- 9846 Country Bend Dr
- 9846 S 2590 W
- 2626 Winding Way
- 2617 Winding Way
- 2529 W Winding Way
- 2529 Winding Way
- 2519 W Country Bend Dr