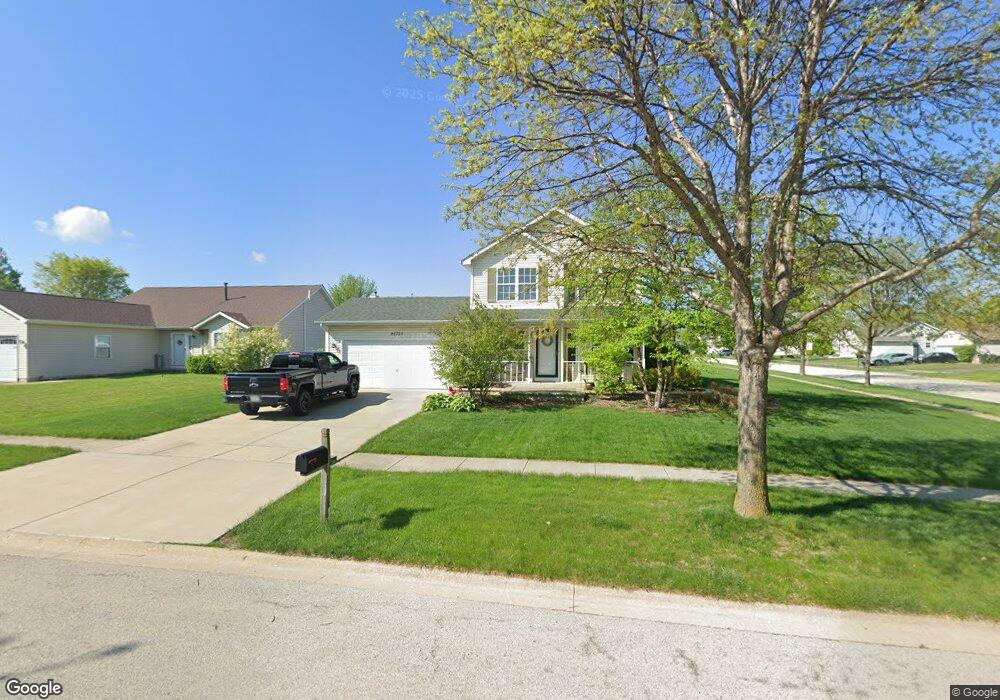
25725 S Cobblestone Ln Channahon, IL 60410
South DuPage River NeighborhoodEstimated Value: $344,000 - $378,000
3
Beds
2
Baths
1,702
Sq Ft
$212/Sq Ft
Est. Value
About This Home
This home is located at 25725 S Cobblestone Ln, Channahon, IL 60410 and is currently estimated at $360,205, approximately $211 per square foot. 25725 S Cobblestone Ln is a home located in Will County with nearby schools including N B Galloway Elementary School, Pioneer Path School, and Three Rivers School.
Ownership History
Date
Name
Owned For
Owner Type
Purchase Details
Closed on
Oct 14, 2011
Sold by
Young Ty M
Bought by
Klode Ryan L
Current Estimated Value
Home Financials for this Owner
Home Financials are based on the most recent Mortgage that was taken out on this home.
Original Mortgage
$123,200
Outstanding Balance
$84,108
Interest Rate
4.12%
Mortgage Type
New Conventional
Estimated Equity
$276,097
Purchase Details
Closed on
May 23, 2005
Sold by
Goss Geoffrey A and Goss Shannon M
Bought by
Young Ty M
Home Financials for this Owner
Home Financials are based on the most recent Mortgage that was taken out on this home.
Original Mortgage
$162,400
Interest Rate
5.91%
Mortgage Type
Fannie Mae Freddie Mac
Purchase Details
Closed on
Jan 31, 2000
Sold by
Citizens First Natl Bank Of Princeton
Bought by
Goss Geoffrey A and Goss Shannon M
Home Financials for this Owner
Home Financials are based on the most recent Mortgage that was taken out on this home.
Original Mortgage
$144,377
Interest Rate
8.16%
Mortgage Type
FHA
Create a Home Valuation Report for This Property
The Home Valuation Report is an in-depth analysis detailing your home's value as well as a comparison with similar homes in the area
Home Values in the Area
Average Home Value in this Area
Purchase History
| Date | Buyer | Sale Price | Title Company |
|---|---|---|---|
| Klode Ryan L | $154,000 | Multiple | |
| Young Ty M | $203,000 | Ticor Title | |
| Goss Geoffrey A | $139,000 | -- |
Source: Public Records
Mortgage History
| Date | Status | Borrower | Loan Amount |
|---|---|---|---|
| Open | Klode Ryan L | $123,200 | |
| Previous Owner | Young Ty M | $162,400 | |
| Previous Owner | Goss Geoffrey A | $144,377 |
Source: Public Records
Tax History
| Year | Tax Paid | Tax Assessment Tax Assessment Total Assessment is a certain percentage of the fair market value that is determined by local assessors to be the total taxable value of land and additions on the property. | Land | Improvement |
|---|---|---|---|---|
| 2024 | $7,783 | $100,289 | $20,106 | $80,183 |
| 2023 | $7,783 | $88,556 | $17,754 | $70,802 |
| 2022 | $6,255 | $78,719 | $16,650 | $62,069 |
| 2021 | $5,846 | $74,403 | $15,737 | $58,666 |
| 2020 | $5,666 | $72,801 | $15,398 | $57,403 |
| 2019 | $5,390 | $69,500 | $14,700 | $54,800 |
| 2018 | $5,039 | $65,083 | $13,820 | $51,263 |
| 2017 | $4,790 | $60,975 | $13,233 | $47,742 |
| 2016 | $4,636 | $58,518 | $12,700 | $45,818 |
| 2015 | $4,122 | $54,250 | $11,700 | $42,550 |
| 2014 | $4,122 | $53,650 | $11,700 | $41,950 |
| 2013 | $4,122 | $53,650 | $11,700 | $41,950 |
Source: Public Records
Map
Nearby Homes
- 26461 W Stonebriar Way
- 25624 S Fieldstone Ct
- 26421 W Fox Trail
- 25653 S Bridle Path
- 25734 S Bridle Path
- 25708 S Bridle Path
- 26140 S Bell Rd
- 25710 S Parkside Dr
- 26511 Wild Rose Dr
- 26124 Rachael Dr
- 26160 W Ravine Woods Dr
- 26708 W Megan Dr
- 26334 W Silver Stream Dr
- 26330 S Settlers Dr
- 26548 W Orchid Ln
- 26546 W Orchid Ln
- 26465 W Orchid Ln
- 26544 W Orchid Ln
- 25253 Forest Edge Dr
- Lot 8-4 Orchid Ln Unit 4
- 26265 Squire Ln
- 26259 Squire Ln
- 25715 S Cobblestone Ln
- 25730 S Cobblestone Ln
- 25728 S Cobblestone Ln
- 25734 S Cobblestone Ln
- 26255 Squire Ln
- 25720 S Cobblestone Ln
- 25716 S Cobblestone Ln
- 25738 S Cobblestone Ln
- 25711 S Cobblestone Ln Unit 8
- 25724 S Cobblestone Ln
- 26247 Squire Ln
- 25726 S Cobblestone Ln
- 25712 S Cobblestone Ln
- 25744 S Cobblestone Ln
- 26243 Squire Ln
- 25709 S Cobblestone Ln
- 25708 S Cobblestone Ln
- 26304 Squire Ln Unit 8
Your Personal Tour Guide
Ask me questions while you tour the home.