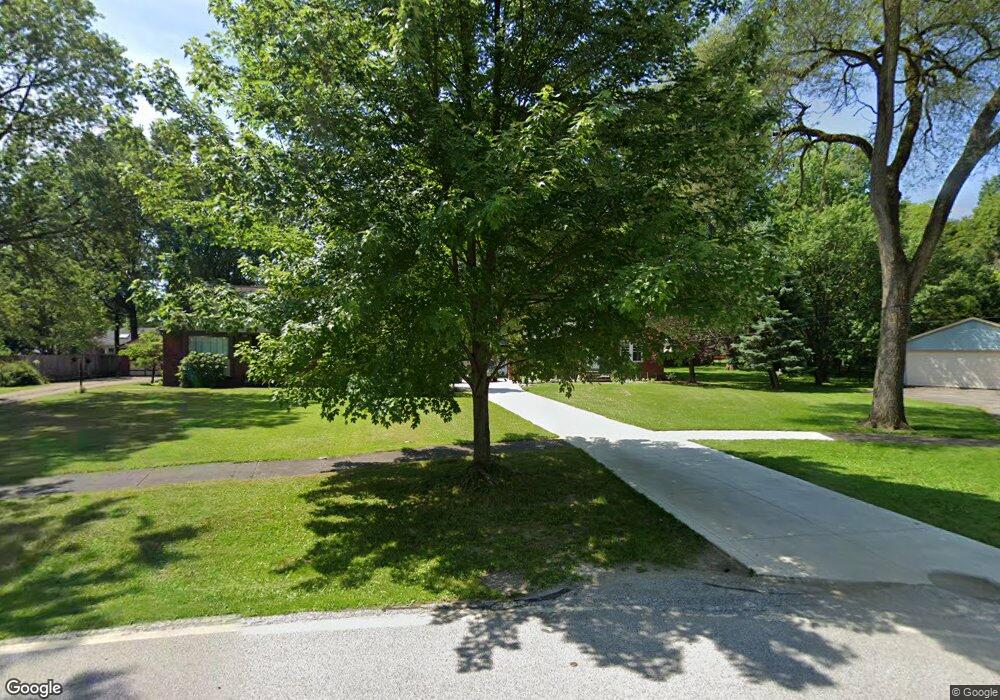
25725 W Hedgewood Dr Westlake, OH 44145
Estimated Value: $371,000 - $510,000
5
Beds
3
Baths
2,537
Sq Ft
$167/Sq Ft
Est. Value
About This Home
This home is located at 25725 W Hedgewood Dr, Westlake, OH 44145 and is currently estimated at $423,332, approximately $166 per square foot. 25725 W Hedgewood Dr is a home located in Cuyahoga County with nearby schools including Dover Intermediate School, Lee Burneson Middle School, and Westlake High School.
Ownership History
Date
Name
Owned For
Owner Type
Purchase Details
Closed on
Nov 19, 2002
Sold by
Fury Sandra P and Fury Timothy P
Bought by
Tomasch Dennis A and Tomasch Catherine A
Current Estimated Value
Home Financials for this Owner
Home Financials are based on the most recent Mortgage that was taken out on this home.
Original Mortgage
$115,000
Interest Rate
6.08%
Purchase Details
Closed on
Dec 11, 1998
Sold by
Kish Richard J and Kish Lana Lee
Bought by
Fury Sandra P
Home Financials for this Owner
Home Financials are based on the most recent Mortgage that was taken out on this home.
Original Mortgage
$132,000
Interest Rate
6.93%
Purchase Details
Closed on
Jul 16, 1976
Sold by
Sigworth Warren E and Sigworth Mary
Bought by
Kish Richard J
Purchase Details
Closed on
Jan 1, 1975
Bought by
Sigworth Warren E and Sigworth Mary
Create a Home Valuation Report for This Property
The Home Valuation Report is an in-depth analysis detailing your home's value as well as a comparison with similar homes in the area
Home Values in the Area
Average Home Value in this Area
Purchase History
| Date | Buyer | Sale Price | Title Company |
|---|---|---|---|
| Tomasch Dennis A | $200,000 | Third Capital | |
| Fury Sandra P | $165,000 | Chicago Title Insurance Comp | |
| Kish Richard J | $44,900 | -- | |
| Sigworth Warren E | -- | -- |
Source: Public Records
Mortgage History
| Date | Status | Borrower | Loan Amount |
|---|---|---|---|
| Previous Owner | Tomasch Dennis A | $115,000 | |
| Previous Owner | Fury Sandra P | $132,000 |
Source: Public Records
Tax History Compared to Growth
Tax History
| Year | Tax Paid | Tax Assessment Tax Assessment Total Assessment is a certain percentage of the fair market value that is determined by local assessors to be the total taxable value of land and additions on the property. | Land | Improvement |
|---|---|---|---|---|
| 2024 | $5,579 | $117,775 | $21,350 | $96,425 |
| 2023 | $5,495 | $99,160 | $18,270 | $80,890 |
| 2022 | $5,407 | $99,160 | $18,270 | $80,890 |
| 2021 | $5,414 | $99,160 | $18,270 | $80,890 |
| 2020 | $5,043 | $84,740 | $15,610 | $69,130 |
| 2019 | $4,890 | $242,100 | $44,600 | $197,500 |
| 2018 | $4,912 | $84,740 | $15,610 | $69,130 |
| 2017 | $4,209 | $68,290 | $12,150 | $56,140 |
| 2016 | $4,186 | $68,290 | $12,150 | $56,140 |
| 2015 | $4,140 | $68,290 | $12,150 | $56,140 |
| 2014 | $4,140 | $66,300 | $11,800 | $54,500 |
Source: Public Records
Map
Nearby Homes
- 25615 Hidden Acres Dr
- 25716 Westwood Rd
- 25715 Westwood Rd
- 2549 Canterbury Rd
- 2063 Columbia Rd
- 2186 Canterbury Rd
- 24502 Cornerstone
- 24500 Westwood Rd
- 2750 Canterbury Rd
- 2021 King James Pkwy Unit 222
- 1930 King James Pkwy Unit 205
- 1851 King James Pkwy Unit 114
- 26553 Hilliard Blvd
- 1931 King James Pkwy Unit 427
- 24407 Westwood Rd
- 25360 Hall Dr
- 24363 Smith Ave
- 25324 Hall Dr
- 24757 Meadow Ln
- 24336 Smith Ave
- 25697 W Hedgewood Dr
- 25684 Hidden Acres Dr
- 25683 W Hedgewood Dr
- 25698 Hidden Acres Dr
- 2390 W Hedgewood Dr
- 25644 Hidden Acres Dr
- 25712 Hidden Acres Dr
- 25696 W Hedgewood Dr
- 2380 W Hedgewood Dr
- 25653 W Hedgewood Dr
- 25630 Hidden Acres Dr
- 25678 W Hedgewood Dr
- 25637 W Hedgewood Dr
- 25683 Hidden Acres Dr
- 25670 W Hedgewood Dr
- 25697 Hidden Acres Dr
- 25616 Hidden Acres Dr
- 25740 Hidden Acres Dr
- 2370 W Hedgewood Dr
- 2383 W Hedgewood Dr