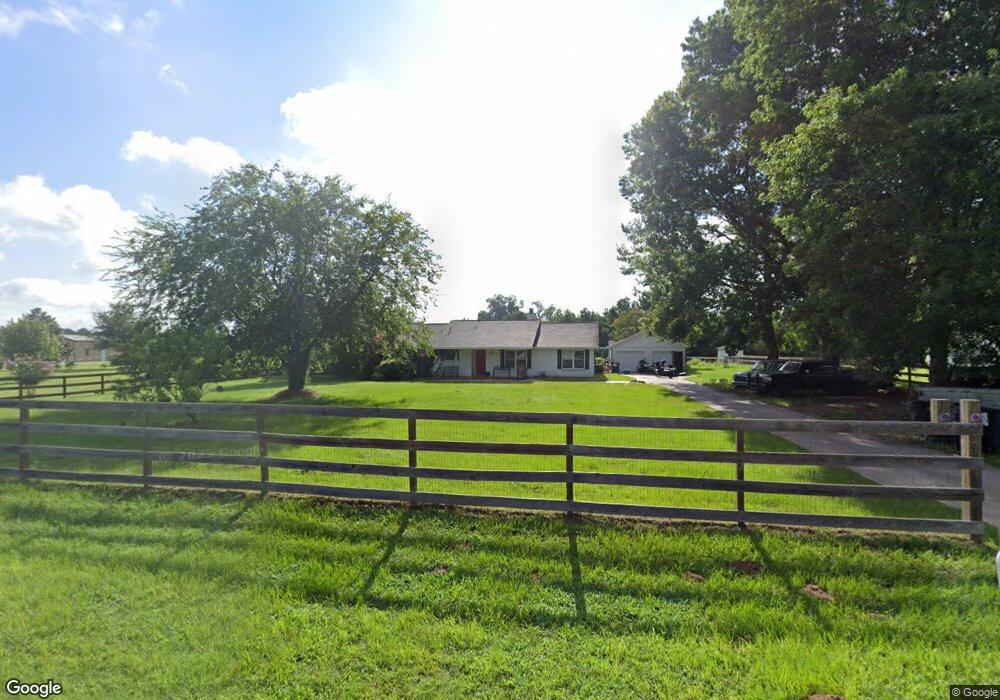
25728 Fish Rd Magnolia, TX 77355
Estimated Value: $274,000 - $447,000
3
Beds
2
Baths
1,691
Sq Ft
$221/Sq Ft
Est. Value
About This Home
This home is located at 25728 Fish Rd, Magnolia, TX 77355 and is currently estimated at $373,026, approximately $220 per square foot. 25728 Fish Rd is a home located in Montgomery County with nearby schools including Decker Prairie Elementary School, Tomball Intermediate School, and Tomball Junior High School.
Ownership History
Date
Name
Owned For
Owner Type
Purchase Details
Closed on
Jul 8, 2016
Sold by
Gale Stanley Terry and Gale Stanley Terry
Bought by
Schuring Austin William
Current Estimated Value
Home Financials for this Owner
Home Financials are based on the most recent Mortgage that was taken out on this home.
Original Mortgage
$176,083
Outstanding Balance
$140,839
Interest Rate
3.64%
Mortgage Type
New Conventional
Estimated Equity
$232,187
Purchase Details
Closed on
Apr 17, 1995
Sold by
Lillard Ozelle Simpson
Bought by
Stanley Mike Steven and Stanley Terry
Home Financials for this Owner
Home Financials are based on the most recent Mortgage that was taken out on this home.
Original Mortgage
$94,750
Interest Rate
8.48%
Mortgage Type
VA
Purchase Details
Closed on
Apr 16, 1995
Sold by
Lillard Ozelle Simpson
Bought by
Schuring Austin William
Home Financials for this Owner
Home Financials are based on the most recent Mortgage that was taken out on this home.
Original Mortgage
$94,750
Interest Rate
8.48%
Mortgage Type
VA
Purchase Details
Closed on
Aug 12, 1991
Sold by
Bennett Troy L
Bought by
Schuring Austin William
Create a Home Valuation Report for This Property
The Home Valuation Report is an in-depth analysis detailing your home's value as well as a comparison with similar homes in the area
Home Values in the Area
Average Home Value in this Area
Purchase History
| Date | Buyer | Sale Price | Title Company |
|---|---|---|---|
| Schuring Austin William | -- | Stewart Title | |
| Stanley Mike Steven | -- | American Title Company | |
| Schuring Austin William | -- | -- | |
| Schuring Austin William | -- | -- |
Source: Public Records
Mortgage History
| Date | Status | Borrower | Loan Amount |
|---|---|---|---|
| Open | Schuring Austin William | $176,083 | |
| Previous Owner | Stanley Mike Steven | $94,750 |
Source: Public Records
Tax History Compared to Growth
Tax History
| Year | Tax Paid | Tax Assessment Tax Assessment Total Assessment is a certain percentage of the fair market value that is determined by local assessors to be the total taxable value of land and additions on the property. | Land | Improvement |
|---|---|---|---|---|
| 2025 | $4,504 | $291,130 | $90,000 | $201,130 |
| 2024 | $4,504 | $267,044 | $90,000 | $177,044 |
| 2023 | $4,497 | $267,690 | $90,000 | $177,690 |
| 2022 | $4,821 | $260,980 | $75,000 | $185,980 |
| 2021 | $3,775 | $196,470 | $50,000 | $146,470 |
| 2020 | $3,938 | $196,470 | $50,000 | $146,470 |
| 2019 | $3,445 | $174,490 | $50,000 | $124,490 |
| 2018 | $3,274 | $157,830 | $28,000 | $129,830 |
| 2017 | $3,285 | $157,880 | $28,000 | $129,880 |
| 2016 | $2,843 | $136,620 | $28,000 | $115,950 |
| 2015 | $2,179 | $124,200 | $12,000 | $115,950 |
| 2014 | $2,179 | $112,910 | $12,000 | $115,950 |
Source: Public Records
Map
Nearby Homes
- 27303 Decker Prairie-Rosehill Rd
- 25404 Decker Prairie-Rosehill Rd
- 25717 Merino Ct
- 26407 Red Clover Dr
- 26443 Red Clover Dr
- 26354 Cedar Sedge Dr
- 26234 Arrowleaf Dr
- 26255 Arrowleaf Dr
- 26275 Arrowleaf Dr
- 26266 Arrowleaf Dr
- 26279 Arrowleaf Dr
- 26270 Arrowleaf Dr
- 26283 Arrowleaf Dr
- 26274 Arrowleaf Dr
- 26278 Arrowleaf Dr
- 26287 Arrowleaf Dr
- 26291 Arrowleaf Dr
- 26282 Arrowleaf Dr
- 26017 Hampshire Dr
- 26286 Arrowleaf Dr
- 25726 Fish Rd
- 25732 Fish Rd
- 25705 Fish Rd
- 25734 Fish Rd
- 25724 Fish Rd
- 25735 Fish Rd
- 25727 Fish Rd
- 25719 Fish Rd
- 25731 Fish Rd
- 25653 Decker Prairie Rosehl Rd
- 25653 Decker Prairie
- 25713 Fish Rd
- 25711 Fish Rd
- 25750 Fish Rd
- 25720 Fish Rd
- 25720 Fish Rd
- 25555 Decker Prairie Rosehl Rd
- 25902 Carlene Rd
- 25407 Decker Prairie
- 25827 Decker Prairie Rosehl Rd