Estimated Value: $383,000 - $427,057
4
Beds
2
Baths
2,300
Sq Ft
$180/Sq Ft
Est. Value
About This Home
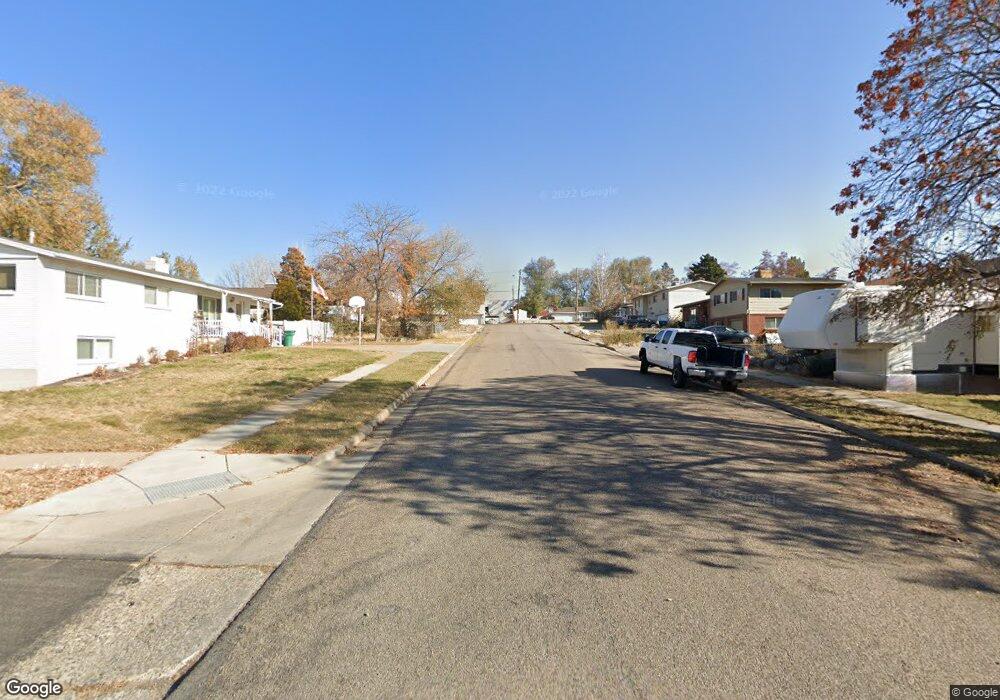
This home is located at 2573 W 4900 S, Roy, UT 84067 and is currently estimated at $414,764, approximately $180 per square foot. 2573 W 4900 S is a home located in Weber County with nearby schools including Lakeview Elementary School, Roy Junior High School, and Roy High School.
Ownership History
Date
Name
Owned For
Owner Type
Purchase Details
Closed on
Oct 13, 2009
Sold by
Oliverson Christopher and Oliverson Sara J
Bought by
Weaver Phillip J
Current Estimated Value
Home Financials for this Owner
Home Financials are based on the most recent Mortgage that was taken out on this home.
Original Mortgage
$132,554
Outstanding Balance
$86,290
Interest Rate
5.02%
Mortgage Type
FHA
Estimated Equity
$328,474
Purchase Details
Closed on
Jan 27, 2005
Sold by
Oliverson Christopher
Bought by
Oliverson Christopher and Oliverson Sara J
Home Financials for this Owner
Home Financials are based on the most recent Mortgage that was taken out on this home.
Original Mortgage
$26,550
Interest Rate
5.08%
Mortgage Type
Stand Alone Second
Create a Home Valuation Report for This Property
The Home Valuation Report is an in-depth analysis detailing your home's value as well as a comparison with similar homes in the area
Home Values in the Area
Average Home Value in this Area
Purchase History
| Date | Buyer | Sale Price | Title Company |
|---|---|---|---|
| Weaver Phillip J | -- | Lincoln Title Ins Agency | |
| Oliverson Christopher | -- | Backman Stewart Title | |
| Oliverson Christopher | -- | Founders Title Company Syrac |
Source: Public Records
Mortgage History
| Date | Status | Borrower | Loan Amount |
|---|---|---|---|
| Open | Weaver Phillip J | $132,554 | |
| Previous Owner | Oliverson Christopher | $26,550 | |
| Previous Owner | Oliverson Christopher | $106,300 |
Source: Public Records
Tax History Compared to Growth
Tax History
| Year | Tax Paid | Tax Assessment Tax Assessment Total Assessment is a certain percentage of the fair market value that is determined by local assessors to be the total taxable value of land and additions on the property. | Land | Improvement |
|---|---|---|---|---|
| 2025 | $2,398 | $376,216 | $121,338 | $254,878 |
| 2024 | $2,341 | $203,499 | $66,736 | $136,763 |
| 2023 | $2,172 | $188,101 | $63,707 | $124,394 |
| 2022 | $2,302 | $206,800 | $55,373 | $151,427 |
| 2021 | $1,792 | $262,000 | $70,585 | $191,415 |
| 2020 | $1,736 | $234,000 | $70,585 | $163,415 |
| 2019 | $1,785 | $228,000 | $42,208 | $185,792 |
| 2018 | $1,633 | $195,000 | $38,126 | $156,874 |
| 2017 | $1,514 | $168,616 | $38,126 | $130,490 |
| 2016 | $1,407 | $83,705 | $19,107 | $64,598 |
| 2015 | $1,250 | $75,346 | $16,299 | $59,047 |
| 2014 | $1,260 | $75,277 | $16,299 | $58,978 |
Source: Public Records
Map
Nearby Homes