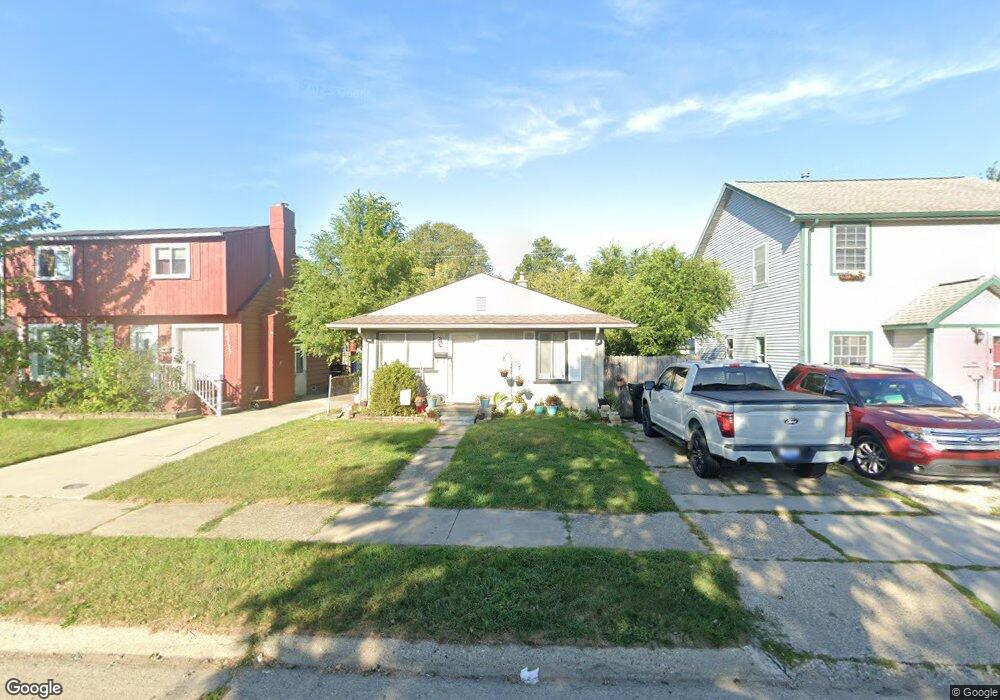
25737 Leach St Roseville, MI 48066
Estimated Value: $144,000 - $208,000
3
Beds
2
Baths
936
Sq Ft
$176/Sq Ft
Est. Value
About This Home
This home is located at 25737 Leach St, Roseville, MI 48066 and is currently estimated at $164,403, approximately $175 per square foot. 25737 Leach St is a home located in Macomb County with nearby schools including Dort Elementary School, Joseph G. Steenland Elementary School, and Fountain Elementary School.
Ownership History
Date
Name
Owned For
Owner Type
Purchase Details
Closed on
Mar 11, 2011
Sold by
Equity Trust Company
Bought by
Carrizales Jennifer and Carrizales Eufemio
Current Estimated Value
Purchase Details
Closed on
Aug 27, 2010
Sold by
Donovan Shaun and Secretary Of Housing & Urban D
Bought by
Equity Trust Company and Kathleen Mctigue Ira
Purchase Details
Closed on
Jan 11, 2010
Sold by
Bac Home Loans Servicing Lp
Bought by
The Secretary Of Housing & Urban Develop
Purchase Details
Closed on
Jul 10, 2009
Sold by
Underwood George and Underwood Diane
Bought by
Bac Home Loans Servicing Lp and Countrywide Home Loans Servicing Lp
Purchase Details
Closed on
Nov 5, 2004
Sold by
Underwood George
Bought by
Underwood George and Underwood Diane
Purchase Details
Closed on
Jun 4, 1999
Sold by
Wieski Robert
Bought by
Underwood George
Create a Home Valuation Report for This Property
The Home Valuation Report is an in-depth analysis detailing your home's value as well as a comparison with similar homes in the area
Home Values in the Area
Average Home Value in this Area
Purchase History
| Date | Buyer | Sale Price | Title Company |
|---|---|---|---|
| Carrizales Jennifer | $59,900 | None Available | |
| Equity Trust Company | $15,001 | None Available | |
| The Secretary Of Housing & Urban Develop | -- | None Available | |
| Bac Home Loans Servicing Lp | $108,401 | None Available | |
| Underwood George | -- | Tri County Title Agency Llc | |
| Underwood George | $87,525 | -- |
Source: Public Records
Tax History Compared to Growth
Tax History
| Year | Tax Paid | Tax Assessment Tax Assessment Total Assessment is a certain percentage of the fair market value that is determined by local assessors to be the total taxable value of land and additions on the property. | Land | Improvement |
|---|---|---|---|---|
| 2025 | $1,737 | $61,500 | $0 | $0 |
| 2024 | $922 | $55,400 | $0 | $0 |
| 2023 | $965 | $49,600 | $0 | $0 |
| 2022 | $1,629 | $42,400 | $0 | $0 |
| 2021 | $1,507 | $36,700 | $0 | $0 |
| 2020 | $860 | $36,100 | $0 | $0 |
| 2019 | $1,322 | $33,700 | $0 | $0 |
| 2018 | $1,297 | $0 | $0 | $0 |
| 2017 | $1,210 | $26,369 | $5,444 | $20,925 |
| 2016 | $1,203 | $26,369 | $0 | $0 |
| 2015 | $776 | $24,128 | $0 | $0 |
| 2013 | -- | $23,207 | $0 | $0 |
| 2011 | -- | $30,508 | $0 | $0 |
Source: Public Records
Map
Nearby Homes
- 25297 Fortuna St
- 25280 Dale St
- 25951 Lehner Ct
- 25239 Lehner St
- 25207 Fortuna St
- 25841 Wiseman St
- 26070 Bryan St
- 25672 Wiseman St
- 25135 Dale St
- 25403 Fern St
- 25688 Fern St
- 25173 Rosenbusch Blvd
- 25294 Wiseman St
- 25221 Tecla Ave
- 25184 Tecla Ave
- 25323 Fern St
- 26260 Bryan St
- 15738 Frazho Rd
- 25143 Fern St
- 14930 E 10 Mile Rd
- 25743 Leach St
- 25735 Leach St
- 25727 Leach St
- 25753 Leach St
- 25622 Send St
- 25656 Send St
- 25721 Leach St
- 25612 Send St
- 25742 Leach St
- 25746 Leach St
- 25732 Leach St
- 25680 Send St
- 25759 Leach St
- 25711 Leach St
- 25752 Leach St
- 25720 Leach St
- 25600 Send St Unit Bldg-Unit
- 25600 Send St
- 25700 Send St
- 25758 Leach St