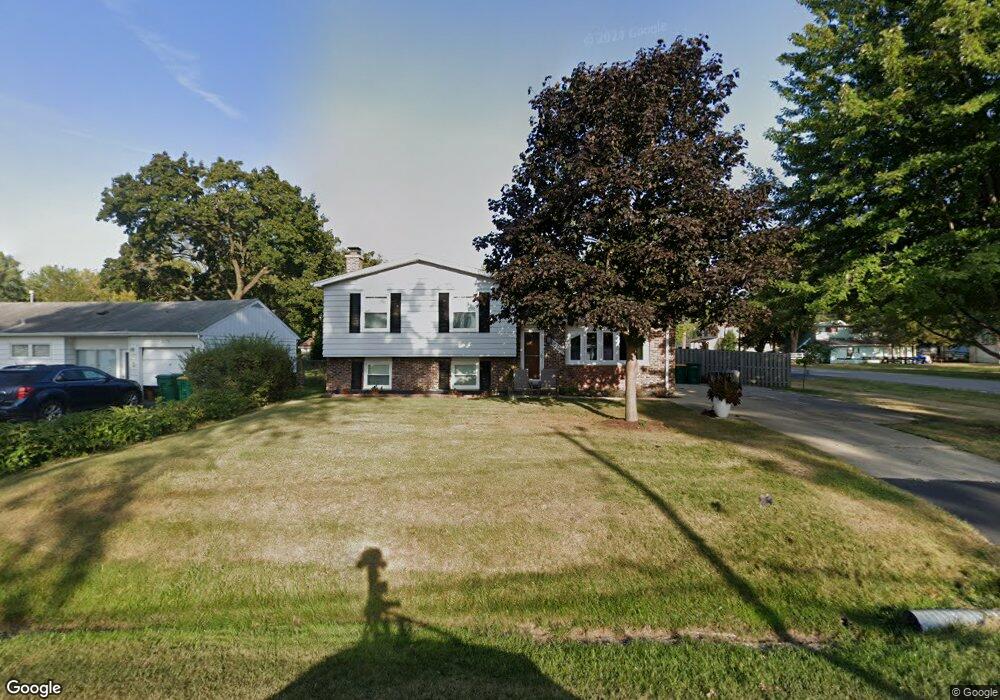
25745 W Lehmann Blvd Unit 1 Lake Villa, IL 60046
Fox Lake Hills NeighborhoodEstimated Value: $269,000 - $335,000
3
Beds
2
Baths
1,192
Sq Ft
$259/Sq Ft
Est. Value
About This Home
This home is located at 25745 W Lehmann Blvd Unit 1, Lake Villa, IL 60046 and is currently estimated at $309,186, approximately $259 per square foot. 25745 W Lehmann Blvd Unit 1 is a home located in Lake County with nearby schools including Gavin Central Elementary School, Gavin South Middle School, and Grant Community High School.
Ownership History
Date
Name
Owned For
Owner Type
Purchase Details
Closed on
Jan 18, 2005
Sold by
Haltom Ronald R and Kurber Mary E
Bought by
Halton Ronald R and Kurber Mary K
Current Estimated Value
Home Financials for this Owner
Home Financials are based on the most recent Mortgage that was taken out on this home.
Original Mortgage
$198,000
Outstanding Balance
$99,703
Interest Rate
5.71%
Mortgage Type
New Conventional
Estimated Equity
$209,483
Purchase Details
Closed on
Jul 30, 1998
Sold by
Sweeney Michael P and Sweeney Mary R
Bought by
Haltom Ronald R and Kurber Mary K
Home Financials for this Owner
Home Financials are based on the most recent Mortgage that was taken out on this home.
Original Mortgage
$140,082
Interest Rate
7.05%
Mortgage Type
FHA
Create a Home Valuation Report for This Property
The Home Valuation Report is an in-depth analysis detailing your home's value as well as a comparison with similar homes in the area
Home Values in the Area
Average Home Value in this Area
Purchase History
| Date | Buyer | Sale Price | Title Company |
|---|---|---|---|
| Halton Ronald R | -- | Netco | |
| Haltom Ronald R | $143,000 | Chicago Title Insurance Co |
Source: Public Records
Mortgage History
| Date | Status | Borrower | Loan Amount |
|---|---|---|---|
| Open | Halton Ronald R | $198,000 | |
| Closed | Haltom Ronald R | $140,082 |
Source: Public Records
Tax History Compared to Growth
Tax History
| Year | Tax Paid | Tax Assessment Tax Assessment Total Assessment is a certain percentage of the fair market value that is determined by local assessors to be the total taxable value of land and additions on the property. | Land | Improvement |
|---|---|---|---|---|
| 2024 | $5,752 | $88,095 | $12,366 | $75,729 |
| 2023 | $5,284 | $77,836 | $10,926 | $66,910 |
| 2022 | $5,284 | $68,231 | $10,831 | $57,400 |
| 2021 | $5,011 | $63,382 | $10,061 | $53,321 |
| 2020 | $4,933 | $61,352 | $9,739 | $51,613 |
| 2019 | $4,790 | $58,964 | $9,360 | $49,604 |
| 2018 | $4,423 | $55,463 | $10,465 | $44,998 |
| 2017 | $4,262 | $53,984 | $10,186 | $43,798 |
| 2016 | $5,012 | $51,799 | $9,774 | $42,025 |
| 2015 | $5,183 | $48,379 | $9,129 | $39,250 |
| 2014 | $5,237 | $52,693 | $10,824 | $41,869 |
| 2012 | $4,851 | $52,947 | $10,876 | $42,071 |
Source: Public Records
Map
Nearby Homes
- 37642 N Amber Way
- 25164 W Sunset Ln
- 25216 W Buena Ave
- 26633 W Astor St
- 38635 N Drexel Blvd
- 38871 N Lakeview Ave
- 38815 N Broadway Ave
- 38856 N Cedar Crest Dr
- 0 Channel Dr
- 25073 W Megan Ct
- 36497 N Hawthorne Ln
- 25058 Megan Ct
- 38830 N Drexel Blvd
- 36391 N Tamarack Dr
- 36379 N Wesley Rd
- 39225 Rangers Way
- 39203 Rangers Way
- 39247 Rangers Way
- 913 Amber Ln
- 908 Amber Ln
- 25735 W Lehmann Blvd Unit 1
- 25662 W Glade Dr
- 25674 W Marshfield Rd
- 25719 W Lehmann Blvd
- 25663 W Chesney Dr Unit 1
- 25660 W Marshfield Rd
- 25705 W Glade Dr
- 25640 W Glade Dr
- 25651 W Chesney Dr
- 25736 W Lehmann Blvd Unit 1
- 25673 W Marshfield Rd
- 25728 W Lehmann Blvd
- 25697 W Marshfield Rd
- 25659 W Marshfield Rd
- 37741 N Delaby Rd
- 25639 W Chesney Dr
- 25721 W Marshfield Rd
- 25720 W Lehmann Blvd
- 37735 N Delaby Rd
- 25620 W Glade Dr Unit 1