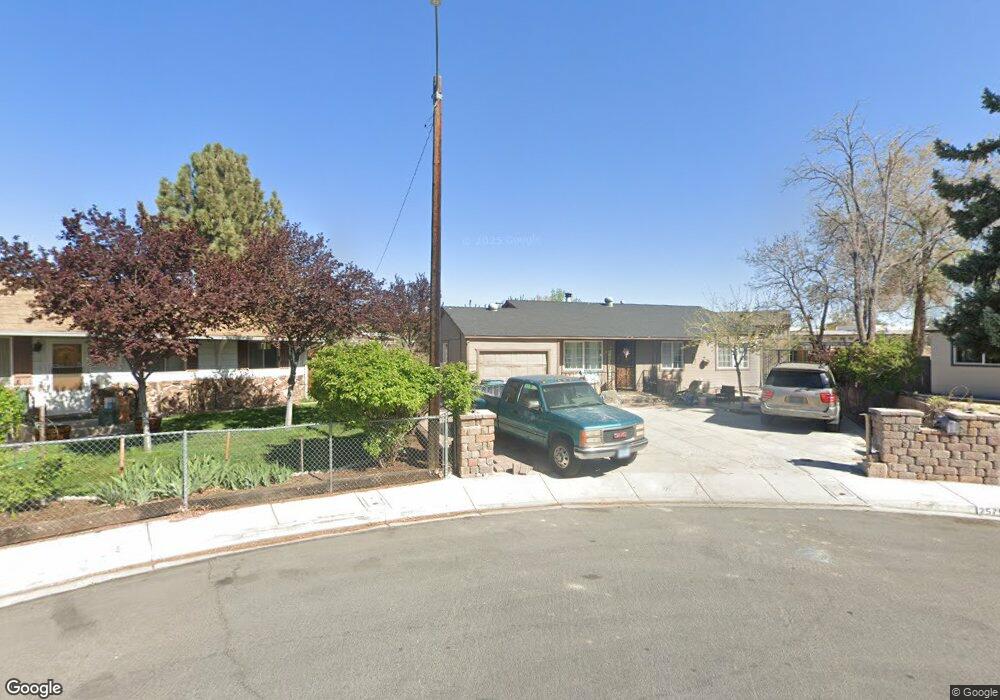
2575 Simms Cir Sparks, NV 89431
McCarran Boulevard-Probasco NeighborhoodEstimated Value: $383,000 - $406,212
3
Beds
1
Bath
1,044
Sq Ft
$381/Sq Ft
Est. Value
About This Home
This home is located at 2575 Simms Cir, Sparks, NV 89431 and is currently estimated at $397,803, approximately $381 per square foot. 2575 Simms Cir is a home located in Washoe County with nearby schools including Florence Drake Elementary School, George L Dilworth Middle School, and Sparks High School.
Ownership History
Date
Name
Owned For
Owner Type
Purchase Details
Closed on
Nov 21, 2023
Sold by
Andrade Monico S
Bought by
Andrade Monico S and Carrillo Maria
Current Estimated Value
Purchase Details
Closed on
Jun 25, 2012
Sold by
Carrillo Maria
Bought by
Andrade Monico S
Home Financials for this Owner
Home Financials are based on the most recent Mortgage that was taken out on this home.
Original Mortgage
$152,785
Interest Rate
3.74%
Mortgage Type
New Conventional
Purchase Details
Closed on
Jun 26, 2002
Sold by
Showalter Kevin P and Showalter Jennifer R
Bought by
Andrade Monico S and Carrillo Maria
Home Financials for this Owner
Home Financials are based on the most recent Mortgage that was taken out on this home.
Original Mortgage
$131,929
Interest Rate
6.86%
Mortgage Type
FHA
Create a Home Valuation Report for This Property
The Home Valuation Report is an in-depth analysis detailing your home's value as well as a comparison with similar homes in the area
Home Values in the Area
Average Home Value in this Area
Purchase History
| Date | Buyer | Sale Price | Title Company |
|---|---|---|---|
| Andrade Monico S | -- | None Listed On Document | |
| Andrade Monico S | -- | None Listed On Document | |
| Andrade Monico S | -- | First American Title Sparks | |
| Andrade Monico S | $134,000 | Founders Title Co |
Source: Public Records
Mortgage History
| Date | Status | Borrower | Loan Amount |
|---|---|---|---|
| Previous Owner | Andrade Monico S | $152,785 | |
| Previous Owner | Andrade Monico S | $131,929 |
Source: Public Records
Tax History
| Year | Tax Paid | Tax Assessment Tax Assessment Total Assessment is a certain percentage of the fair market value that is determined by local assessors to be the total taxable value of land and additions on the property. | Land | Improvement |
|---|---|---|---|---|
| 2026 | $650 | $49,828 | $34,090 | $15,738 |
| 2024 | $1,712 | $45,487 | $30,065 | $15,422 |
| 2023 | $1,645 | $45,581 | $31,325 | $14,256 |
| 2022 | $1,554 | $37,770 | $26,180 | $11,590 |
| 2021 | $1,453 | $29,267 | $17,955 | $11,312 |
| 2020 | $1,233 | $28,043 | $16,940 | $11,103 |
| 2019 | $1,393 | $26,382 | $15,890 | $10,492 |
| 2018 | $1,264 | $21,802 | $11,725 | $10,077 |
| 2017 | $528 | $20,290 | $10,395 | $9,895 |
| 2016 | $519 | $19,237 | $9,345 | $9,892 |
| 2015 | $1,163 | $17,417 | $7,700 | $9,717 |
| 2014 | $1,113 | $15,629 | $6,440 | $9,189 |
| 2013 | -- | $13,219 | $4,270 | $8,949 |
Source: Public Records
Map
Nearby Homes
- 2475 Stine Way
- 705 York Way
- 343 Richards Way
- 1940 4th St Unit 20
- 1940 4th St Unit 51
- 1940 4th St Unit 46
- 1945 4th St Unit 22
- 1945 4th St Unit 51
- 181 Quail St
- 1023 Tyler Way
- 115 P St
- 28 Arndell Way
- 1125 Dodson Way
- 3214 Valley Forge Way
- 91 E York Way
- 105 O St
- 314 M St
- 8 E O St
- 2557 Janelle Dr
- 14 E Greenbrae Dr
Your Personal Tour Guide
Ask me questions while you tour the home.