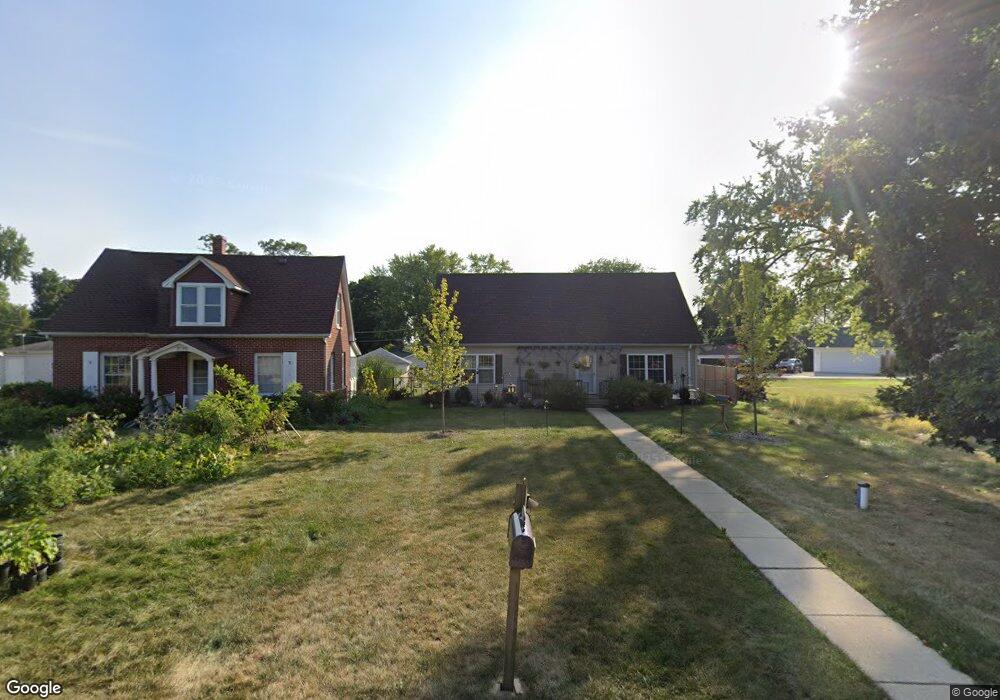
25759 W Arcade Dr S Lake Villa, IL 60046
Fox Lake Hills NeighborhoodEstimated Value: $287,000 - $408,160
4
Beds
3
Baths
1,716
Sq Ft
$204/Sq Ft
Est. Value
About This Home
This home is located at 25759 W Arcade Dr S, Lake Villa, IL 60046 and is currently estimated at $350,790, approximately $204 per square foot. 25759 W Arcade Dr S is a home located in Lake County with nearby schools including Gavin Central Elementary School, Gavin South Middle School, and Grant Community High School.
Ownership History
Date
Name
Owned For
Owner Type
Purchase Details
Closed on
Dec 26, 2017
Sold by
Fannie Mae
Bought by
Gorski Harry C and Gorski Shannon
Current Estimated Value
Home Financials for this Owner
Home Financials are based on the most recent Mortgage that was taken out on this home.
Original Mortgage
$167,255
Interest Rate
3.92%
Mortgage Type
Unknown
Purchase Details
Closed on
Apr 12, 2017
Sold by
Dickerson Larry and Dickerson Leroy W
Bought by
Federal National Mortgage Association
Purchase Details
Closed on
Nov 27, 2001
Sold by
Cornerstone Homes Llc
Bought by
Dickerson Larry
Home Financials for this Owner
Home Financials are based on the most recent Mortgage that was taken out on this home.
Original Mortgage
$127,000
Interest Rate
6.39%
Purchase Details
Closed on
Aug 8, 2001
Sold by
Dickerson Larry
Bought by
Cornerstone Homes Llc
Purchase Details
Closed on
May 10, 1993
Sold by
State Bank Of Antioch
Bought by
Dickerson Larry
Create a Home Valuation Report for This Property
The Home Valuation Report is an in-depth analysis detailing your home's value as well as a comparison with similar homes in the area
Home Values in the Area
Average Home Value in this Area
Purchase History
| Date | Buyer | Sale Price | Title Company |
|---|---|---|---|
| Gorski Harry C | $184,450 | Fidelity National Title | |
| Federal National Mortgage Association | -- | None Available | |
| Dickerson Larry | -- | Chicago Title Insurance Co | |
| Cornerstone Homes Llc | -- | First American Title | |
| Dickerson Larry | -- | -- |
Source: Public Records
Mortgage History
| Date | Status | Borrower | Loan Amount |
|---|---|---|---|
| Closed | Gorski Harry C | $167,255 | |
| Previous Owner | Dickerson Larry | $127,000 |
Source: Public Records
Tax History Compared to Growth
Tax History
| Year | Tax Paid | Tax Assessment Tax Assessment Total Assessment is a certain percentage of the fair market value that is determined by local assessors to be the total taxable value of land and additions on the property. | Land | Improvement |
|---|---|---|---|---|
| 2024 | $7,105 | $109,373 | $13,335 | $96,038 |
| 2023 | $6,702 | $96,636 | $11,782 | $84,854 |
| 2022 | $6,702 | $87,920 | $11,535 | $76,385 |
| 2021 | $6,358 | $81,672 | $10,715 | $70,957 |
| 2020 | $6,263 | $79,056 | $10,372 | $68,684 |
| 2019 | $6,084 | $75,979 | $9,968 | $66,011 |
| 2018 | $5,368 | $71,048 | $11,146 | $59,902 |
| 2017 | $4,934 | $69,153 | $10,849 | $58,304 |
| 2016 | $5,830 | $66,353 | $10,410 | $55,943 |
| 2015 | $6,038 | $61,972 | $9,723 | $52,249 |
| 2014 | $2,682 | $68,544 | $11,907 | $56,637 |
| 2012 | $2,354 | $68,874 | $11,964 | $56,910 |
Source: Public Records
Map
Nearby Homes
- 37322 N Stanton Point Rd
- 36497 N Hawthorne Ln
- 25164 W Sunset Ln
- 25216 W Buena Ave
- 36379 N Wesley Rd
- 26633 W Astor St
- 42 Rushmore Rd
- 38815 N Broadway Ave
- 38871 N Lakeview Ave
- 91 Lippincott Rd
- 43 Lippincott Rd
- 25058 Megan Ct
- 913 Amber Ln
- 35835 N Benjamin Ave
- 908 Amber Ln
- 69 Washington St
- 24570 W Blackcherry Ln
- 50 N Lake Ave
- 314 Mastodon Dr
- 35729 N Watson Ave
- 25753 W Arcade Dr N
- 25747 Arcade Dr N
- 37362 N Bay Shore Rd
- 25785 W Arcade Dr N
- 25785 W Arcade Dr S
- 25739 W Arcade Dr N
- 37370 N Bay Shore Rd
- 37384 N Shore Dr
- 25770 W Arcade Dr N
- 25731 W Arcade Dr N
- 37392 N Shore Dr
- 37368 N Lake Shore Dr
- 37406 Shore Dr
- 37354 N Bay Shore Rd
- 25788 W Arcade Dr N
- 37420 N Lake Shore Dr
- 25783 W Arcade Dr N
- 37414 Shore Dr
- 986 Shore Dr
- 968 Shore Dr