
Landlord's Agent in 2015
Takisha Wood
Atlanta Communities
(404) 844-4198
86 Total Sales
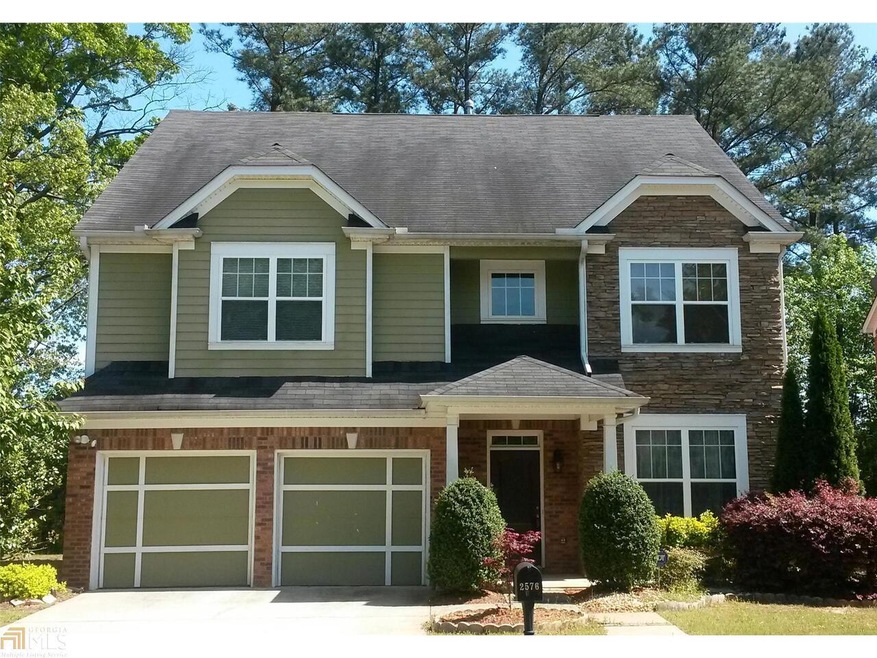
Estimated Value: $413,000 - $463,000
THIS LAVISHLY BUILT 6BR 3.5BA SPACIOUS HOME FEATURES INCLUDE: BEAUTIFUL HARDWOOD FLOORING, TWO HUGE MASTER BEDROOMS WITH LUXURIOUS MASTER BATHS, AN OVERSIZED GOURMET KITCHEN AND BREAKFAST AREA, FORMAL LIVING AND DINING ROOMS. THIS IS A MUST SEE FLOOR PLAN, THIS HOME IS LOCATED WITHIN MINUTES OF PARKS, SHOPPING CENTERS, WALKING TRAILS AND MUCH MORE. PETS ALLOWED, SOME RESTRICTIONS APPLY. WASHER AND DRYER INCLUDED!
Last Agent to Rent the Property
Atlanta Communities License #350052 Listed on: 04/24/2015
| Date | Buyer | Sale Price | Title Company |
|---|---|---|---|
| Stephenson Mithcell Frank | -- | -- | |
| Stephenson Mitchell Frank | -- | -- | |
| Stephenson Mitchell Frank | $209,000 | -- | |
| Tsogbe Koffi | $230,300 | -- |
| Date | Status | Borrower | Loan Amount |
|---|---|---|---|
| Previous Owner | Stephenson Mitchell Frank | $202,730 | |
| Previous Owner | Tsogbe Koffi | $223,367 |
| Date | Event | Price | List to Sale | Price per Sq Ft |
|---|---|---|---|---|
| 04/24/2015 04/24/15 | Rented | $1,450 | 0.0% | -- |
| 04/24/2015 04/24/15 | For Rent | $1,450 | -- | -- |
| Year | Tax Paid | Tax Assessment Tax Assessment Total Assessment is a certain percentage of the fair market value that is determined by local assessors to be the total taxable value of land and additions on the property. | Land | Improvement |
|---|---|---|---|---|
| 2025 | $6,377 | $189,000 | $26,000 | $163,000 |
| 2024 | $6,313 | $168,040 | $32,800 | $135,240 |
| 2023 | $6,313 | $163,040 | $32,800 | $130,240 |
| 2022 | $5,277 | $139,680 | $24,000 | $115,680 |
| 2021 | $4,089 | $104,600 | $18,000 | $86,600 |
| 2020 | $4,112 | $104,600 | $18,000 | $86,600 |
| 2019 | $3,244 | $98,920 | $18,000 | $80,920 |
| 2018 | $3,536 | $92,360 | $18,000 | $74,360 |
| 2016 | $2,890 | $79,320 | $14,000 | $65,320 |
| 2015 | $2,757 | $74,720 | $14,000 | $60,720 |
| 2014 | $2,581 | $69,400 | $14,000 | $55,400 |
Landlord's Agent in 2015
Takisha Wood
Atlanta Communities
(404) 844-4198
86 Total Sales
Source: Georgia MLS
MLS Number: 7443742
APN: 7-017-224
Disclaimer: Certain information contained herein is derived from information provided by parties other than Homes.com. All information provided is deemed reliable, but is not guaranteed to be accurate and should be independently verified.
![]() The data relating to real estate for sale on this web site comes in part from the Broker Reciprocity Program of Georgia MLS. Real estate listings held by brokerage firms other than Redfin are marked with the Broker Reciprocity logo and detailed information about them includes the name of the listing brokers. Information deemed reliable but not guaranteed. Copyright 2025 Georgia MLS. All rights reserved.
The data relating to real estate for sale on this web site comes in part from the Broker Reciprocity Program of Georgia MLS. Real estate listings held by brokerage firms other than Redfin are marked with the Broker Reciprocity logo and detailed information about them includes the name of the listing brokers. Information deemed reliable but not guaranteed. Copyright 2025 Georgia MLS. All rights reserved.