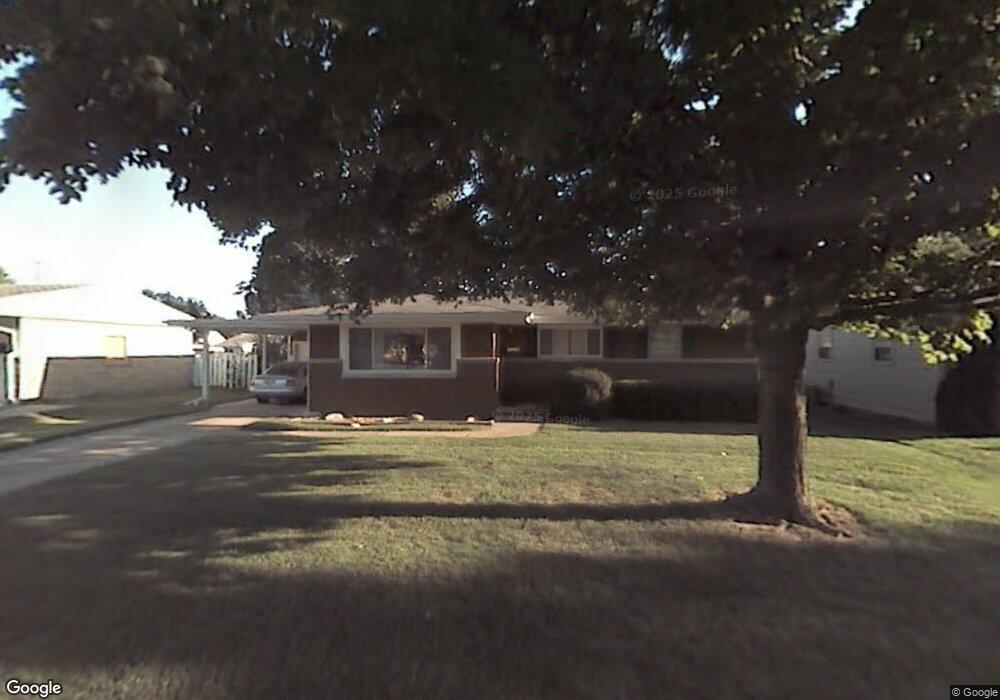
2577 Lafayette Dr Lafayette, IN 47909
Edgelea NeighborhoodEstimated Value: $189,000 - $220,000
--
Bed
--
Bath
1,261
Sq Ft
$163/Sq Ft
Est. Value
About This Home
This home is located at 2577 Lafayette Dr, Lafayette, IN 47909 and is currently estimated at $205,744, approximately $163 per square foot. 2577 Lafayette Dr is a home located in Tippecanoe County with nearby schools including Edgelea Elementary School, Lafayette Tecumseh Junior High School, and Sunnyside Intermediate School.
Ownership History
Date
Name
Owned For
Owner Type
Purchase Details
Closed on
May 28, 2020
Sold by
Paul Kelly Lynn
Bought by
Foster Jessica R
Current Estimated Value
Home Financials for this Owner
Home Financials are based on the most recent Mortgage that was taken out on this home.
Original Mortgage
$89,871
Outstanding Balance
$79,664
Interest Rate
3.2%
Mortgage Type
New Conventional
Estimated Equity
$126,080
Purchase Details
Closed on
Aug 30, 2017
Sold by
Kendall Robert G
Bought by
Paul Kelly Lynn
Home Financials for this Owner
Home Financials are based on the most recent Mortgage that was taken out on this home.
Original Mortgage
$83,460
Interest Rate
5.5%
Mortgage Type
FHA
Purchase Details
Closed on
Jul 7, 2003
Sold by
Shively Kent Alan and Shively Trisha Ann
Bought by
Kendall Robert G
Home Financials for this Owner
Home Financials are based on the most recent Mortgage that was taken out on this home.
Original Mortgage
$94,760
Interest Rate
5.36%
Mortgage Type
VA
Create a Home Valuation Report for This Property
The Home Valuation Report is an in-depth analysis detailing your home's value as well as a comparison with similar homes in the area
Home Values in the Area
Average Home Value in this Area
Purchase History
| Date | Buyer | Sale Price | Title Company |
|---|---|---|---|
| Foster Jessica R | -- | Metropolitan Title | |
| Paul Kelly Lynn | -- | -- | |
| Kendall Robert G | -- | -- |
Source: Public Records
Mortgage History
| Date | Status | Borrower | Loan Amount |
|---|---|---|---|
| Open | Foster Jessica R | $89,871 | |
| Previous Owner | Paul Kelly Lynn | $83,460 | |
| Previous Owner | Kendall Robert G | $94,760 |
Source: Public Records
Tax History Compared to Growth
Tax History
| Year | Tax Paid | Tax Assessment Tax Assessment Total Assessment is a certain percentage of the fair market value that is determined by local assessors to be the total taxable value of land and additions on the property. | Land | Improvement |
|---|---|---|---|---|
| 2024 | $1,299 | $148,800 | $21,100 | $127,700 |
| 2023 | $1,178 | $138,500 | $21,100 | $117,400 |
| 2022 | $1,134 | $123,900 | $21,100 | $102,800 |
| 2021 | $900 | $106,600 | $21,100 | $85,500 |
| 2020 | $598 | $88,300 | $12,000 | $76,300 |
| 2019 | $535 | $84,500 | $12,000 | $72,500 |
| 2018 | $491 | $81,200 | $12,000 | $69,200 |
| 2017 | $533 | $79,900 | $12,000 | $67,900 |
| 2016 | $1,471 | $73,400 | $12,000 | $61,400 |
| 2014 | $446 | $76,000 | $12,000 | $64,000 |
| 2013 | $430 | $75,200 | $12,000 | $63,200 |
Source: Public Records
Map
Nearby Homes
- 901 Southlea Dr
- 2501 Crestview Ct
- 2609 Oxford St
- 2605 Oxford St
- 1017 Sarasota Dr
- 2516 Oxford St
- 2508 Oxford St
- 1005 Sarasota Dr
- 1303 Rochelle Dr
- 2776 Medford St
- 1405 Rochelle Dr
- 40 East Ct
- 2830 Duroc Dr Unit A
- 2417 Foxhall Dr
- 2514 Eckman Dr
- 2201 Meadow Dr
- 1006 Southport Dr
- 1018 Southport Dr
- 2060 Crestview Ct
- 912 Crestview Place
- 2573 Lafayette Dr
- 2581 Lafayette Dr
- 912 Beck Ln
- 2585 Lafayette Dr
- 2569 Lafayette Dr
- 916 Beck Ln
- 908 Beck Ln
- 2553 Whitehall Dr
- 2564 Whitehall Dr
- 2565 Lafayette Dr
- 2552 Lafayette Dr
- 2601 S 9th St
- 2605 S 9th St
- 924 Beck Ln
- 904 Beck Ln
- 2549 Whitehall Dr
- 2560 Whitehall Dr
- 928 Beck Ln
- 2553 S 9th St
- 2548 Lafayette Dr