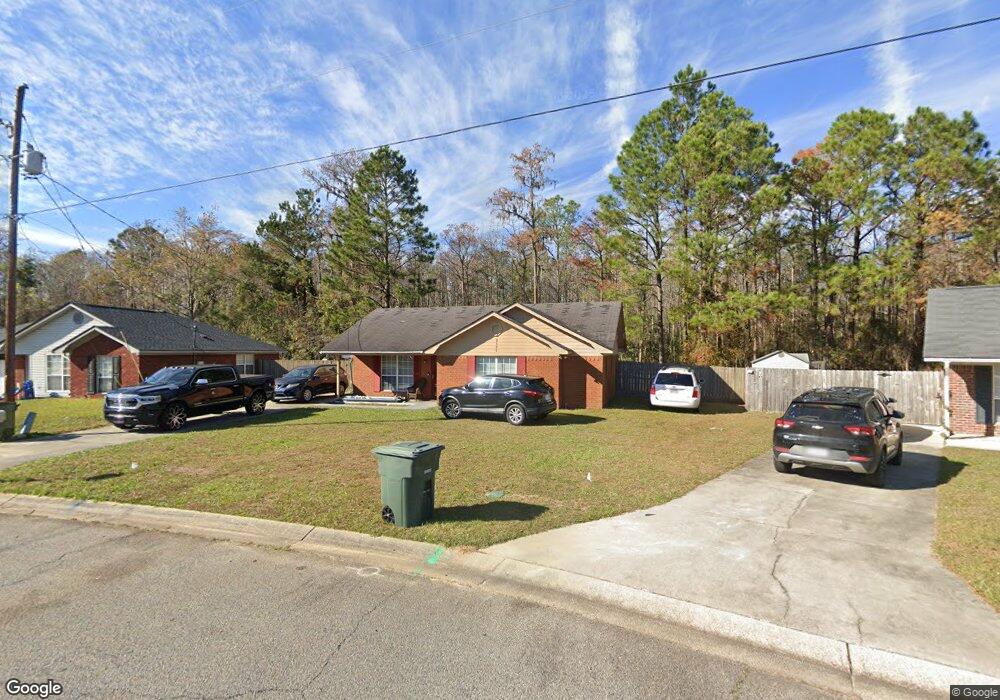
2577 Zachary Ct Hinesville, GA 31313
Estimated Value: $185,000 - $196,586
3
Beds
2
Baths
1,135
Sq Ft
$168/Sq Ft
Est. Value
About This Home
This home is located at 2577 Zachary Ct, Hinesville, GA 31313 and is currently estimated at $190,897, approximately $168 per square foot. 2577 Zachary Ct is a home located in Liberty County with nearby schools including Waldo Pafford Elementary School, Lewis Frasier Middle School, and Bradwell Institute.
Ownership History
Date
Name
Owned For
Owner Type
Purchase Details
Closed on
Jan 12, 2021
Sold by
Gantt David
Bought by
Gantt David and Gantt Emma L
Current Estimated Value
Purchase Details
Closed on
Apr 18, 2018
Sold by
Chapman Patricia B
Bought by
Gantt David
Home Financials for this Owner
Home Financials are based on the most recent Mortgage that was taken out on this home.
Original Mortgage
$95,000
Interest Rate
4.45%
Mortgage Type
VA
Purchase Details
Closed on
May 9, 2005
Sold by
Engler Jason R
Bought by
Chapman Patricia B
Home Financials for this Owner
Home Financials are based on the most recent Mortgage that was taken out on this home.
Original Mortgage
$70,800
Interest Rate
5.88%
Mortgage Type
FHA
Purchase Details
Closed on
Aug 13, 2003
Sold by
Engler Jason R and Engler Mel
Bought by
Engler Jason R
Purchase Details
Closed on
May 31, 2001
Sold by
Brown David
Bought by
Engler Jason R and Engler Mel
Purchase Details
Closed on
Jul 31, 1998
Sold by
Solid Rock Enterpris
Bought by
Brown David
Purchase Details
Closed on
Jan 12, 1997
Bought by
Solid Rock Enterpris
Create a Home Valuation Report for This Property
The Home Valuation Report is an in-depth analysis detailing your home's value as well as a comparison with similar homes in the area
Home Values in the Area
Average Home Value in this Area
Purchase History
| Date | Buyer | Sale Price | Title Company |
|---|---|---|---|
| Gantt David | -- | -- | |
| Gantt David | $95,000 | -- | |
| Chapman Patricia B | $73,000 | -- | |
| Engler Jason R | -- | -- | |
| Engler Jason R | $59,900 | -- | |
| Brown David | $64,000 | -- | |
| Solid Rock Enterpris | $13,000 | -- |
Source: Public Records
Mortgage History
| Date | Status | Borrower | Loan Amount |
|---|---|---|---|
| Previous Owner | Gantt David | $95,000 | |
| Previous Owner | Chapman Patricia B | $70,800 |
Source: Public Records
Tax History Compared to Growth
Tax History
| Year | Tax Paid | Tax Assessment Tax Assessment Total Assessment is a certain percentage of the fair market value that is determined by local assessors to be the total taxable value of land and additions on the property. | Land | Improvement |
|---|---|---|---|---|
| 2024 | $1,980 | $59,422 | $12,000 | $47,422 |
| 2023 | $1,980 | $54,286 | $12,000 | $42,286 |
| 2022 | $1,667 | $45,601 | $10,000 | $35,601 |
| 2021 | $1,583 | $38,452 | $8,000 | $30,452 |
| 2020 | $1,738 | $36,147 | $8,000 | $28,147 |
| 2019 | $1,647 | $34,490 | $6,000 | $28,490 |
| 2018 | $1,587 | $33,392 | $6,000 | $27,392 |
| 2017 | $1,110 | $33,718 | $6,000 | $27,718 |
| 2016 | $1,482 | $32,708 | $6,000 | $26,708 |
| 2015 | $1,653 | $32,708 | $6,000 | $26,708 |
| 2014 | $1,653 | $36,148 | $8,000 | $28,148 |
| 2013 | -- | $33,344 | $8,000 | $25,344 |
Source: Public Records
Map
Nearby Homes
- 2563 Zachary Ct
- 2716 Java Ct
- 0 Airport Rd Unit 325633
- 269 Brightleaf Cir
- 0 Curtis Rd Unit 163007
- 0 Curtis Rd Unit SA339536
- 225 Rendell Ln
- 307 Lumpkin Ln
- 1.17 ACRES Elam Rd
- 851 Lyndsi Ln
- 302 Largo Ct
- 201 Slayton Cir
- 303 Camden Ct
- 164 Glynn Ct
- 644 Piedmont Ave
- 33 Bryan Way
- 219 Augusta Way
- 104 Shallowford Cir
- 213 Augusta Way
- 2579 Zachary Ct
- 2575 Zachary Ct
- 2581 Zachary Ct
- 2573 Zachary Ct
- 2574 Zachary Ct
- 2576 Zachary Ct
- 2571 Zachary Ct
- 2583 Zachary Ct
- 2578 Zachary Ct
- 2601 Page Ln
- 2603 Page Ln
- 2569 Zachary Ct
- 2580 Zachary Ct
- 2582 Zachary Ct
- 2605 Page Ln
- 2567 Zachary Ct Unit n/a
- 2567 Zachary Ct
- 2607 Page Ln
- 0 Zachary Ct Unit 7317397
- 0 Page Ln Unit 7317770