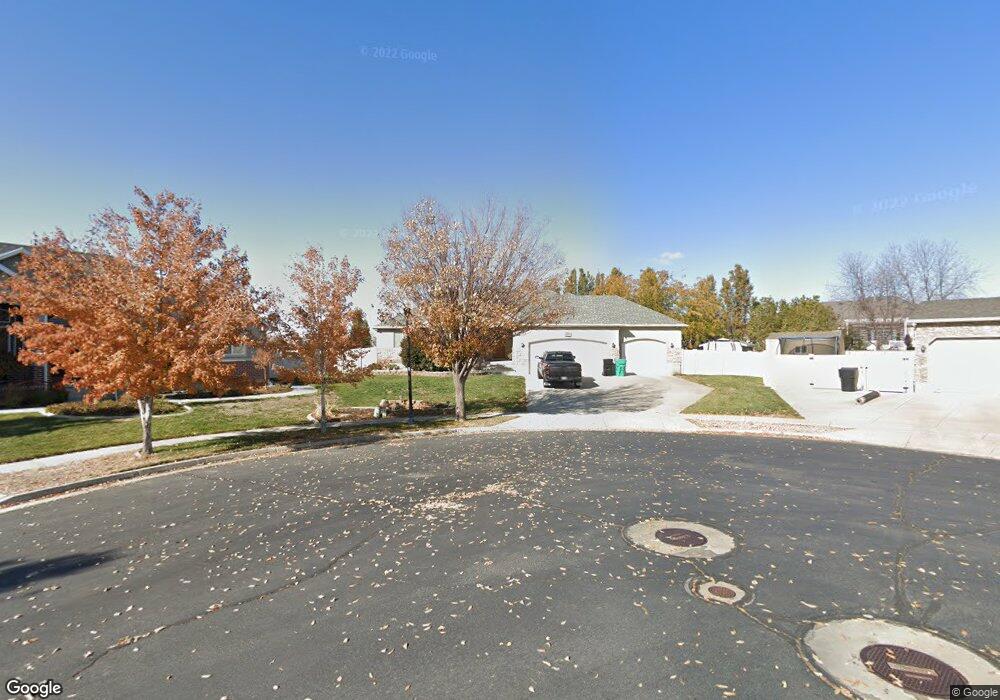
2578 S 575 W Syracuse, UT 84075
Estimated Value: $638,000 - $757,000
5
Beds
3
Baths
3,558
Sq Ft
$200/Sq Ft
Est. Value
About This Home
This home is located at 2578 S 575 W, Syracuse, UT 84075 and is currently estimated at $711,296, approximately $199 per square foot. 2578 S 575 W is a home located in Davis County with nearby schools including Bluff Ridge Elementary, Legacy Junior High School, and Clearfield High School.
Ownership History
Date
Name
Owned For
Owner Type
Purchase Details
Closed on
May 18, 2020
Sold by
Schendel Kelsey and Schendel Christopher
Bought by
Schendel Kelsey B and Schendel Christopher S
Current Estimated Value
Home Financials for this Owner
Home Financials are based on the most recent Mortgage that was taken out on this home.
Original Mortgage
$331,650
Outstanding Balance
$293,888
Interest Rate
3.3%
Mortgage Type
VA
Estimated Equity
$417,408
Purchase Details
Closed on
Jun 29, 2006
Sold by
Dahlberg Michael S
Bought by
Dahlberg Michael S and Dahlberg Susan L
Home Financials for this Owner
Home Financials are based on the most recent Mortgage that was taken out on this home.
Original Mortgage
$212,720
Interest Rate
6.57%
Mortgage Type
New Conventional
Create a Home Valuation Report for This Property
The Home Valuation Report is an in-depth analysis detailing your home's value as well as a comparison with similar homes in the area
Home Values in the Area
Average Home Value in this Area
Purchase History
| Date | Buyer | Sale Price | Title Company |
|---|---|---|---|
| Schendel Kelsey B | -- | Stewart Title Ins Agenc | |
| Dahlberg Michael S | -- | First American Title | |
| Dahlberg Michael S | -- | Meridian Title Company |
Source: Public Records
Mortgage History
| Date | Status | Borrower | Loan Amount |
|---|---|---|---|
| Open | Schendel Kelsey B | $331,650 | |
| Closed | Dahlberg Michael S | $212,720 |
Source: Public Records
Tax History Compared to Growth
Tax History
| Year | Tax Paid | Tax Assessment Tax Assessment Total Assessment is a certain percentage of the fair market value that is determined by local assessors to be the total taxable value of land and additions on the property. | Land | Improvement |
|---|---|---|---|---|
| 2025 | $3,723 | $359,150 | $127,953 | $231,197 |
| 2024 | $3,539 | $343,750 | $108,737 | $235,013 |
| 2023 | $3,407 | $603,000 | $151,343 | $451,657 |
| 2022 | $3,656 | $354,750 | $86,715 | $268,035 |
| 2021 | $3,096 | $465,000 | $128,479 | $336,521 |
| 2020 | $2,819 | $410,000 | $110,452 | $299,548 |
| 2019 | $2,793 | $401,000 | $109,759 | $291,241 |
| 2018 | $2,590 | $369,000 | $105,034 | $263,966 |
| 2016 | $2,158 | $161,260 | $40,248 | $121,012 |
| 2015 | $2,270 | $161,535 | $40,248 | $121,287 |
| 2014 | $2,134 | $154,776 | $40,248 | $114,528 |
| 2013 | -- | $148,813 | $37,728 | $111,085 |
Source: Public Records
Map
Nearby Homes