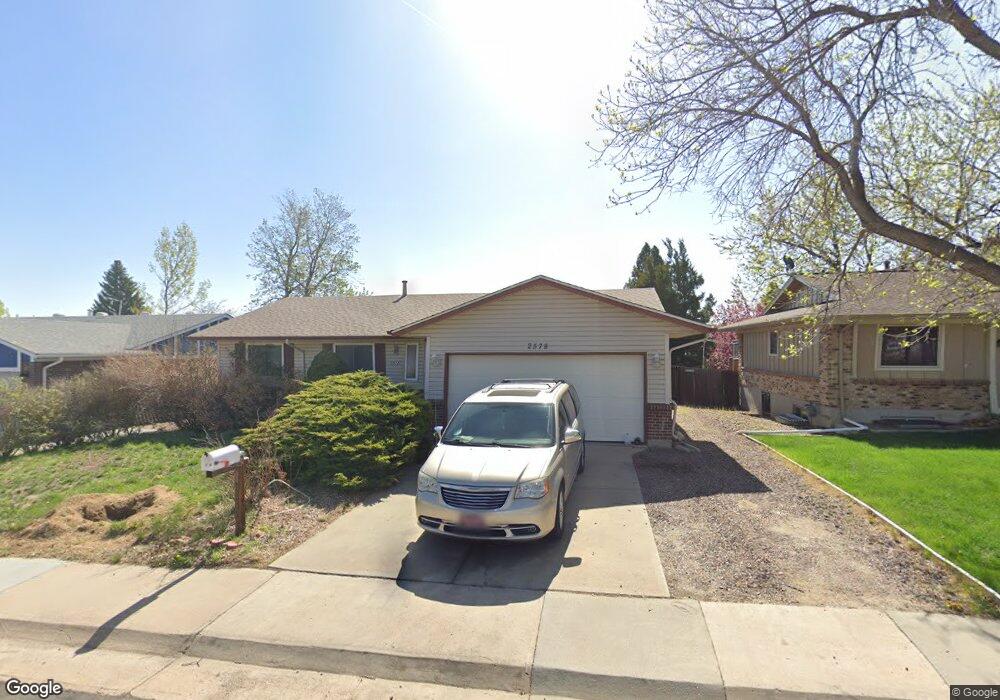
2578 S Pitkin Way Aurora, CO 80013
Lakeshore NeighborhoodEstimated Value: $441,000 - $476,000
3
Beds
2
Baths
2,178
Sq Ft
$210/Sq Ft
Est. Value
About This Home
This home is located at 2578 S Pitkin Way, Aurora, CO 80013 and is currently estimated at $457,920, approximately $210 per square foot. 2578 S Pitkin Way is a home located in Arapahoe County with nearby schools including Dalton Elementary School, Columbia Middle School, and Rangeview High School.
Ownership History
Date
Name
Owned For
Owner Type
Purchase Details
Closed on
Nov 10, 2017
Sold by
Simmons Edgar David and Simmons Megan Lyn
Bought by
Nancy Sue Jackson Revocable Trust
Current Estimated Value
Purchase Details
Closed on
Aug 7, 2014
Sold by
Stockton Carol and Estate Of Leila B Schock
Bought by
Simmons Edgar David and Simmons Megan Lyn
Home Financials for this Owner
Home Financials are based on the most recent Mortgage that was taken out on this home.
Original Mortgage
$213,265
Interest Rate
4.62%
Mortgage Type
FHA
Purchase Details
Closed on
May 10, 1988
Sold by
Conversion Arapco
Bought by
Schock Alvin D Schock Leila B
Purchase Details
Closed on
Sep 1, 1984
Sold by
Conversion Arapco
Bought by
Conversion Arapco
Purchase Details
Closed on
Oct 1, 1978
Sold by
Conversion Arapco
Bought by
Conversion Arapco
Purchase Details
Closed on
Jul 4, 1776
Bought by
Conversion Arapco
Create a Home Valuation Report for This Property
The Home Valuation Report is an in-depth analysis detailing your home's value as well as a comparison with similar homes in the area
Home Values in the Area
Average Home Value in this Area
Purchase History
| Date | Buyer | Sale Price | Title Company |
|---|---|---|---|
| Nancy Sue Jackson Revocable Trust | $310,000 | Chicago Title | |
| Simmons Edgar David | $221,000 | Stewart Title | |
| Schock Alvin D Schock Leila B | -- | -- | |
| Conversion Arapco | -- | -- | |
| Conversion Arapco | -- | -- | |
| Conversion Arapco | -- | -- |
Source: Public Records
Mortgage History
| Date | Status | Borrower | Loan Amount |
|---|---|---|---|
| Previous Owner | Simmons Edgar David | $213,265 |
Source: Public Records
Tax History Compared to Growth
Tax History
| Year | Tax Paid | Tax Assessment Tax Assessment Total Assessment is a certain percentage of the fair market value that is determined by local assessors to be the total taxable value of land and additions on the property. | Land | Improvement |
|---|---|---|---|---|
| 2024 | $2,701 | $29,058 | -- | -- |
| 2023 | $2,701 | $29,058 | $0 | $0 |
| 2022 | $2,307 | $22,977 | $0 | $0 |
| 2021 | $2,382 | $22,977 | $0 | $0 |
| 2020 | $2,466 | $23,688 | $0 | $0 |
| 2019 | $2,453 | $23,688 | $0 | $0 |
| 2018 | $1,862 | $17,611 | $0 | $0 |
| 2017 | $1,620 | $17,611 | $0 | $0 |
| 2016 | $1,565 | $16,660 | $0 | $0 |
| 2015 | $1,511 | $16,660 | $0 | $0 |
| 2014 | -- | $10,929 | $0 | $0 |
| 2013 | -- | $13,630 | $0 | $0 |
Source: Public Records
Map
Nearby Homes
- 2515 S Pagosa St
- 2490 S Rifle St
- 17307 E Wesley Ave
- 2318 S Rifle St
- 2721 S Salida Way
- 17538 E Baker Place
- 17512 E Wesley Place
- 17516 E Wesley Place
- 17503 E Caspian Place
- 2757 S Sedalia St
- 16879 E Amherst Ave
- 2764 S Sedalia St
- 17400 E Brunswick Place
- 17634 E Brown Cir
- 17909 E Brown Place
- 16570 E Lasalle Place
- 17968 E Amherst Ave
- 2215 S Buckley Rd Unit 201
- 2743 S Waco Way
- 17969 E Brown Place
- 2558 S Pitkin Way
- 2588 S Pitkin Way
- 2569 S Quintero Way
- 2579 S Quintero Way
- 2548 S Pitkin Way
- 2598 S Pitkin Way
- 2567 S Quintero Way
- 2557 S Pitkin Way
- 2577 S Pitkin Way
- 2599 S Quintero Way
- 2547 S Pitkin Way
- 2538 S Pitkin Way
- 2597 S Pitkin Way
- 2565 S Quintero Way
- 2537 S Pitkin Way
- 2556 S Pagosa St
- 2570 S Quintero Way
- 2576 S Pagosa St
- 2600 S Pitkin Way
- 2580 S Quintero Way