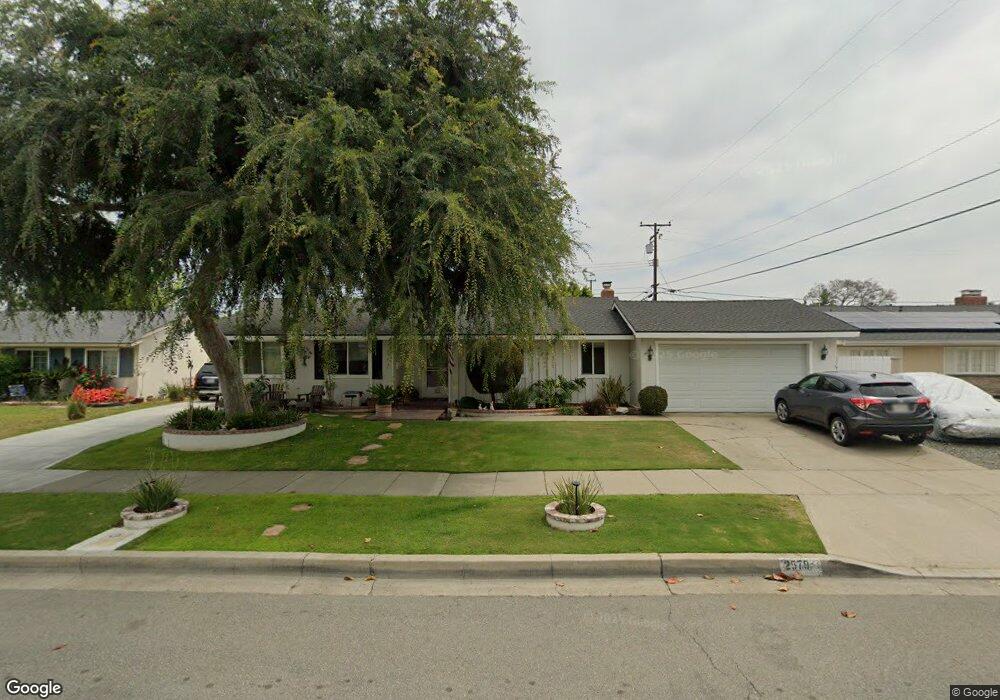
2579 N Torres St Orange, CA 92865
Estimated Value: $952,690 - $1,111,000
3
Beds
2
Baths
1,318
Sq Ft
$781/Sq Ft
Est. Value
About This Home
This home is located at 2579 N Torres St, Orange, CA 92865 and is currently estimated at $1,029,423, approximately $781 per square foot. 2579 N Torres St is a home located in Orange County with nearby schools including Olive Elementary School, Cerro Villa Middle School, and Villa Park High School.
Ownership History
Date
Name
Owned For
Owner Type
Purchase Details
Closed on
Apr 13, 2023
Sold by
Lawrence Charles
Bought by
Lawrence Trust
Current Estimated Value
Purchase Details
Closed on
Aug 17, 2004
Sold by
Lawrence Charles
Bought by
Lawrence Charles
Home Financials for this Owner
Home Financials are based on the most recent Mortgage that was taken out on this home.
Original Mortgage
$50,000
Interest Rate
5.92%
Mortgage Type
Credit Line Revolving
Purchase Details
Closed on
Oct 14, 1997
Sold by
Lawrence Patricia A
Bought by
Lawrence Charles
Create a Home Valuation Report for This Property
The Home Valuation Report is an in-depth analysis detailing your home's value as well as a comparison with similar homes in the area
Home Values in the Area
Average Home Value in this Area
Purchase History
| Date | Buyer | Sale Price | Title Company |
|---|---|---|---|
| Lawrence Trust | -- | None Listed On Document | |
| Lawrence Charles | -- | -- | |
| Lawrence Charles | -- | -- |
Source: Public Records
Mortgage History
| Date | Status | Borrower | Loan Amount |
|---|---|---|---|
| Previous Owner | Lawrence Charles | $50,000 |
Source: Public Records
Tax History
| Year | Tax Paid | Tax Assessment Tax Assessment Total Assessment is a certain percentage of the fair market value that is determined by local assessors to be the total taxable value of land and additions on the property. | Land | Improvement |
|---|---|---|---|---|
| 2025 | $3,301 | $287,772 | $185,305 | $102,467 |
| 2024 | $3,301 | $282,130 | $181,672 | $100,458 |
| 2023 | $3,224 | $276,599 | $178,110 | $98,489 |
| 2022 | $3,158 | $271,176 | $174,618 | $96,558 |
| 2021 | $3,072 | $265,859 | $171,194 | $94,665 |
| 2020 | $3,043 | $263,133 | $169,438 | $93,695 |
| 2019 | $3,005 | $257,974 | $166,116 | $91,858 |
| 2018 | $2,959 | $252,916 | $162,859 | $90,057 |
| 2017 | $2,840 | $247,957 | $159,665 | $88,292 |
| 2016 | $2,786 | $243,096 | $156,535 | $86,561 |
| 2015 | $2,744 | $239,445 | $154,184 | $85,261 |
| 2014 | $2,684 | $234,755 | $151,164 | $83,591 |
Source: Public Records
Map
Nearby Homes
- 2620 N Dunbar St
- 1403 E Sail Ave
- 2433 N Cameo Ct
- 16732 E Main St
- 16780 E Buena Vista Ave
- 1800 E Heim Ave Unit 48
- 1800 E Heim Ave Unit 29
- 3176 N Tustin St
- 2035 E Orangeview Ln
- 1110 E Meats Ave
- 3036 N Skywood St
- 928 E Meats Ave
- 130 W Crystal View Ave
- 2850 N Glassell St
- 2556 N Ridgecrest Ln
- 2078 E Nohl Ranch Rd
- 2092 E Nohl Ranch Rd
- 1040 E Del Mar Ave
- 3158 N Beechwood St
- 3132 N Westhaven St
- 2567 N Torres St
- 2593 N Torres St
- 2580 N Franki St
- 2594 N Franki St
- 2564 N Franki St
- 2557 N Torres St
- 2580 N Torres St
- 2601 N Torres St
- 2594 N Torres St
- 2566 N Torres St
- 2600 N Franki St
- 2544 N Franki St
- 2547 N Torres St
- 2556 N Torres St
- 2600 N Torres St
- 2615 N Torres St
- 2579 N Franki St
- 2614 N Franki St
- 2535 N Torres St
- 2593 N Franki St
Your Personal Tour Guide
Ask me questions while you tour the home.