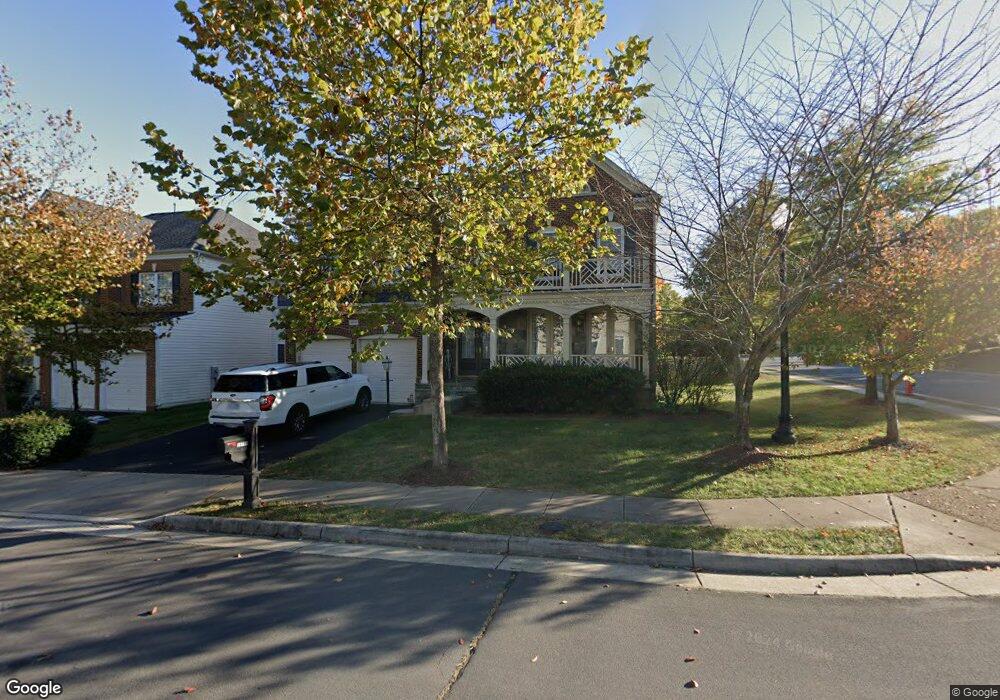
25798 South Village Dr Chantilly, VA 20152
Estimated Value: $1,054,752 - $1,159,000
4
Beds
4
Baths
3,378
Sq Ft
$333/Sq Ft
Est. Value
About This Home
This home is located at 25798 South Village Dr, Chantilly, VA 20152 and is currently estimated at $1,124,438, approximately $332 per square foot. 25798 South Village Dr is a home located in Loudoun County with nearby schools including Little River Elementary School, J. Michael Lunsford Middle School, and Freedom High School.
Ownership History
Date
Name
Owned For
Owner Type
Purchase Details
Closed on
Dec 21, 2020
Sold by
Salehi Afghani and Salehi Faiz M
Bought by
Everman Julie Marie and Everman Keith Thomas
Current Estimated Value
Home Financials for this Owner
Home Financials are based on the most recent Mortgage that was taken out on this home.
Original Mortgage
$663,509
Outstanding Balance
$591,774
Interest Rate
2.8%
Mortgage Type
New Conventional
Estimated Equity
$532,664
Purchase Details
Closed on
Jan 26, 2016
Sold by
Arlp Reo V Llc
Bought by
Afghani Salehi Faiz M and Afghani Salehi
Purchase Details
Closed on
Jun 13, 2005
Sold by
Winchester Homes Inc
Bought by
Portillo Jose Samuel
Home Financials for this Owner
Home Financials are based on the most recent Mortgage that was taken out on this home.
Original Mortgage
$648,975
Interest Rate
5.78%
Mortgage Type
New Conventional
Create a Home Valuation Report for This Property
The Home Valuation Report is an in-depth analysis detailing your home's value as well as a comparison with similar homes in the area
Home Values in the Area
Average Home Value in this Area
Purchase History
| Date | Buyer | Sale Price | Title Company |
|---|---|---|---|
| Everman Julie Marie | $826,000 | Monument Title Co Inc | |
| Afghani Salehi Faiz M | $587,589 | Champion Title & Settlements | |
| Arlp Re V Llc | -- | None Available | |
| Portillo Jose Samuel | $692,240 | -- |
Source: Public Records
Mortgage History
| Date | Status | Borrower | Loan Amount |
|---|---|---|---|
| Open | Everman Julie Marie | $663,509 | |
| Previous Owner | Portillo Jose Samuel | $648,975 |
Source: Public Records
Tax History Compared to Growth
Tax History
| Year | Tax Paid | Tax Assessment Tax Assessment Total Assessment is a certain percentage of the fair market value that is determined by local assessors to be the total taxable value of land and additions on the property. | Land | Improvement |
|---|---|---|---|---|
| 2025 | $8,507 | $1,056,830 | $299,700 | $757,130 |
| 2024 | $8,881 | $1,026,690 | $314,700 | $711,990 |
| 2023 | $8,065 | $921,740 | $314,700 | $607,040 |
| 2022 | $7,828 | $879,510 | $244,700 | $634,810 |
| 2021 | $7,492 | $764,510 | $214,700 | $549,810 |
| 2020 | $7,116 | $687,540 | $199,700 | $487,840 |
| 2019 | $6,975 | $667,430 | $199,700 | $467,730 |
| 2018 | $7,127 | $656,910 | $179,700 | $477,210 |
| 2017 | $7,050 | $626,650 | $179,700 | $446,950 |
| 2016 | $6,904 | $602,970 | $0 | $0 |
| 2015 | $7,101 | $445,900 | $0 | $445,900 |
| 2014 | $7,092 | $434,310 | $0 | $434,310 |
Source: Public Records
Map
Nearby Homes
- 43023 Spyder Place
- 25857 Kirkwood Square
- 26089 Wendell St
- 25670 S Village Dr
- 43356 Hillpark St
- 0 Braddock Rd Unit VALO2086014
- 42835 Shaler St
- 43441 Bettys Farm Dr
- 25442 Herring Creek Dr
- 43017 Beachall St
- 26134 Lands End Dr
- 25390 Shipley Terrace
- 43362 Wayfarer Square
- 42791 Flannigan Terrace
- 26005 Hartwood Dr
- 42768 Kearney Terrace
- 42799 Sykes Terrace
- 42790 Sykes Terrace
- 25466 Chambers Dr
- 25304 Shipley Terrace
- 25798 S Village Dr
- 25794 South Village Dr
- 25794 S Village Dr
- 25790 South Village Dr
- 25790 S Village Dr
- 25788 Longforest Dr
- 25786 S Village Dr
- 25791 South Village Dr
- 25847 Mews Terrace
- 25786 South Village Dr
- 25791 S Village Dr
- 25845 Mews Terrace
- 25843 Mews Terrace
- 25841 Mews Terrace
- 25782 S Village Dr
- 43060 Edgewater St
- 25784 Longforest Dr
- 25839 Mews Terrace
- 25782 South Village Dr
- 25775 South Village Dr