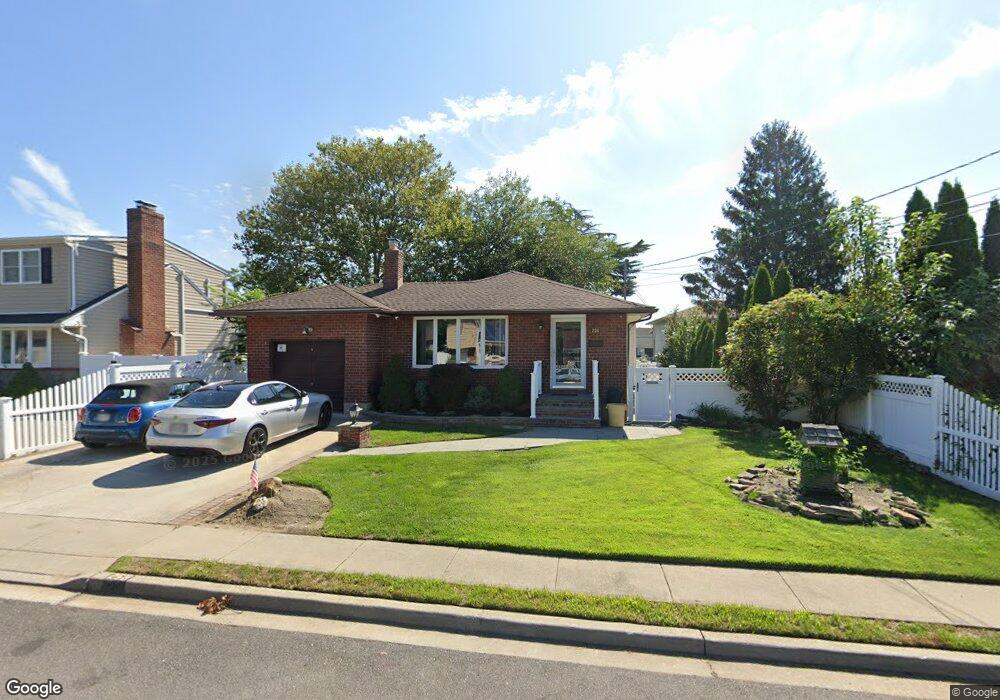
258 9th St Bethpage, NY 11714
Estimated Value: $733,217 - $875,000
3
Beds
2
Baths
1,093
Sq Ft
$736/Sq Ft
Est. Value
About This Home
This home is located at 258 9th St, Bethpage, NY 11714 and is currently estimated at $804,109, approximately $735 per square foot. 258 9th St is a home located in Nassau County with nearby schools including Charles Campagne Elementary School, John F Kennedy Middle School, and Bethpage Senior High School.
Ownership History
Date
Name
Owned For
Owner Type
Purchase Details
Closed on
Nov 5, 2018
Sold by
Sirignano Veronica C
Bought by
Imbroto Louis
Current Estimated Value
Home Financials for this Owner
Home Financials are based on the most recent Mortgage that was taken out on this home.
Original Mortgage
$382,025
Outstanding Balance
$332,538
Interest Rate
4.7%
Mortgage Type
New Conventional
Estimated Equity
$471,571
Purchase Details
Closed on
Feb 27, 2002
Purchase Details
Closed on
Jan 18, 2002
Sold by
Luca Salvatore
Bought by
Sirignano Louis and Sirignano Veronica
Create a Home Valuation Report for This Property
The Home Valuation Report is an in-depth analysis detailing your home's value as well as a comparison with similar homes in the area
Home Values in the Area
Average Home Value in this Area
Purchase History
| Date | Buyer | Sale Price | Title Company |
|---|---|---|---|
| Imbroto Louis | $477,500 | Fidelity National Title Ins | |
| -- | -- | -- | |
| Sirignano Louis | $304,000 | -- |
Source: Public Records
Mortgage History
| Date | Status | Borrower | Loan Amount |
|---|---|---|---|
| Open | Imbroto Louis | $382,025 |
Source: Public Records
Tax History
| Year | Tax Paid | Tax Assessment Tax Assessment Total Assessment is a certain percentage of the fair market value that is determined by local assessors to be the total taxable value of land and additions on the property. | Land | Improvement |
|---|---|---|---|---|
| 2025 | $13,176 | $472 | $232 | $240 |
| 2024 | $4,157 | $452 | $222 | $230 |
Source: Public Records
Map
Nearby Homes
Your Personal Tour Guide
Ask me questions while you tour the home.