Estimated Value: $380,000 - $406,054
4
Beds
3
Baths
2,150
Sq Ft
$183/Sq Ft
Est. Value
About This Home
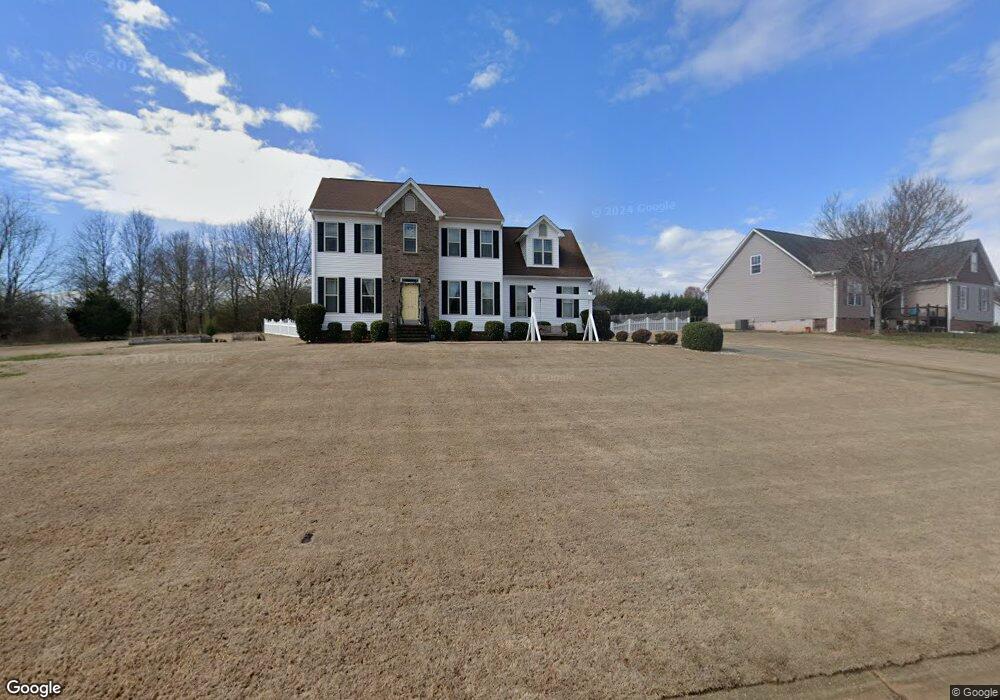
This home is located at 258 Abners Trail Rd, Greer, SC 29651 and is currently estimated at $392,764, approximately $182 per square foot. 258 Abners Trail Rd is a home located in Spartanburg County with nearby schools including Abner Creek Academy, Byrnes Freshman Academy, and Berry Shoals Intermediate School.
Ownership History
Date
Name
Owned For
Owner Type
Purchase Details
Closed on
Jan 31, 2011
Sold by
Elite Southern Homebuilders Inc
Bought by
Ball Charles Andrew and Ball Stephanie Marie
Current Estimated Value
Home Financials for this Owner
Home Financials are based on the most recent Mortgage that was taken out on this home.
Original Mortgage
$131,920
Outstanding Balance
$90,111
Interest Rate
4.82%
Mortgage Type
New Conventional
Estimated Equity
$302,653
Purchase Details
Closed on
Jan 27, 2010
Sold by
Branch Banking & Trust Company
Bought by
Elite Southern Homebuilders Inc
Home Financials for this Owner
Home Financials are based on the most recent Mortgage that was taken out on this home.
Original Mortgage
$157,000
Interest Rate
5.16%
Mortgage Type
Construction
Purchase Details
Closed on
May 18, 2009
Sold by
Brown Samuel A
Bought by
Branch Banking & Trust Company
Create a Home Valuation Report for This Property
The Home Valuation Report is an in-depth analysis detailing your home's value as well as a comparison with similar homes in the area
Home Values in the Area
Average Home Value in this Area
Purchase History
| Date | Buyer | Sale Price | Title Company |
|---|---|---|---|
| Ball Charles Andrew | $164,900 | -- | |
| Elite Southern Homebuilders Inc | $15,000 | -- | |
| Branch Banking & Trust Company | $500 | -- |
Source: Public Records
Mortgage History
| Date | Status | Borrower | Loan Amount |
|---|---|---|---|
| Open | Ball Charles Andrew | $131,920 | |
| Previous Owner | Elite Southern Homebuilders Inc | $157,000 |
Source: Public Records
Tax History Compared to Growth
Tax History
| Year | Tax Paid | Tax Assessment Tax Assessment Total Assessment is a certain percentage of the fair market value that is determined by local assessors to be the total taxable value of land and additions on the property. | Land | Improvement |
|---|---|---|---|---|
| 2025 | $1,261 | $9,152 | $1,044 | $8,108 |
| 2024 | $1,261 | $9,152 | $1,044 | $8,108 |
| 2023 | $1,261 | $9,152 | $1,044 | $8,108 |
| 2022 | $1,140 | $7,958 | $780 | $7,178 |
| 2021 | $1,140 | $7,958 | $780 | $7,178 |
| 2020 | $1,117 | $7,958 | $780 | $7,178 |
| 2019 | $1,117 | $7,958 | $780 | $7,178 |
| 2018 | $1,077 | $7,958 | $780 | $7,178 |
| 2017 | $909 | $6,920 | $800 | $6,120 |
| 2016 | $871 | $6,920 | $800 | $6,120 |
| 2015 | $866 | $6,920 | $800 | $6,120 |
| 2014 | $859 | $6,920 | $800 | $6,120 |
Source: Public Records
Map
Nearby Homes
- 521 Hillview Knoll Ln
- 316 Terra Plains Dr
- 351 Terra Plains Dr
- 126 Ward Oak Ct
- 104 Ward Oak Ct
- 132 High Meadows Ln
- 10785 Reidville Rd
- 10938 Reidville Rd
- 1004 Brockman Rd
- 110 Diana Ct
- 106 Chandelle Ridge Dr
- 6 Danielsen Ct
- Johnson Plan at Chestnut Grove
- Jamestown Plan at Chestnut Grove
- Oakley Plan at Chestnut Grove
- Bloomington Plan at Chestnut Grove
- Brentwood Plan at Chestnut Grove
- Gibson Plan at Chestnut Grove
- 0 Thompson Rd
- 2765 Brockman McClimon Rd
- 254 Abners Trail Rd
- 250 Abners Trail Rd
- 259 Abners Trail Rd
- 169 Abners Run Dr
- 165 Abners Run Dr
- 255 Abners Trail Rd
- 246 Abners Trail Rd
- 251 Abners Trail Rd
- 161 Abners Run Dr
- 247 Abners Trail Rd
- 242 Abners Trail Rd
- 168 Abners Run Dr
- 157 Abners Run Dr
- 153 Abners Run Dr
- 243 Abners Trail Rd
- 610 Brown Canyon Ct
- 238 Abners Trail Rd
- 160 Abners Run Dr
- 606 Brown Canyon Ct
- 239 Abners Trail Rd