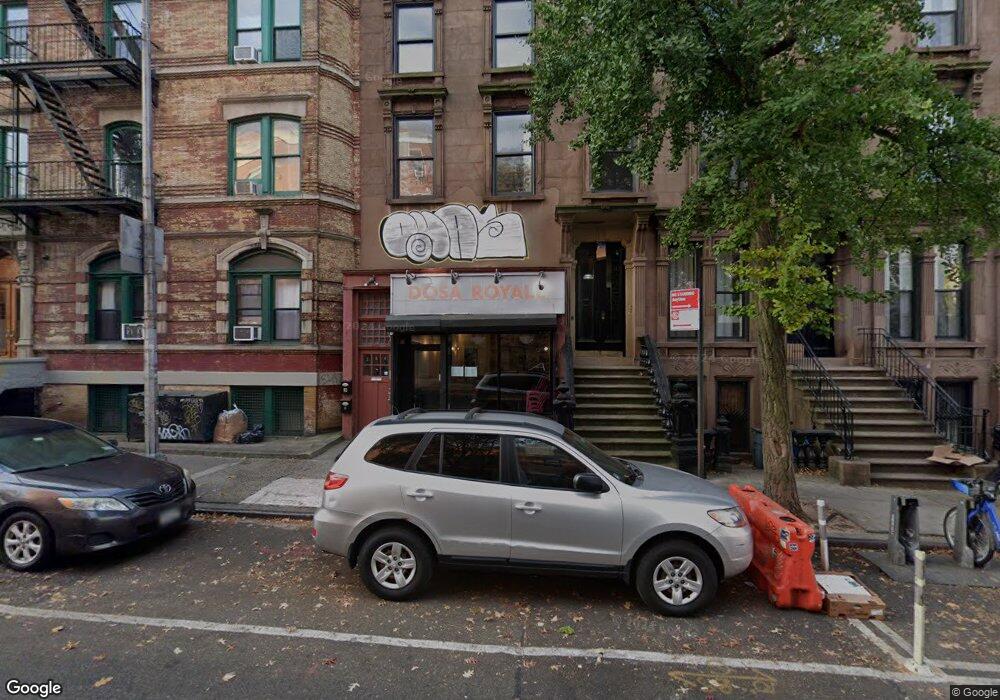
258 Dekalb Ave Brooklyn, NY 11205
Clinton Hill NeighborhoodEstimated Value: $1,928,660
2
Beds
1
Bath
2,560
Sq Ft
$753/Sq Ft
Est. Value
About This Home
This home is located at 258 Dekalb Ave, Brooklyn, NY 11205 and is currently estimated at $1,928,660, approximately $753 per square foot. 258 Dekalb Ave is a home located in Kings County with nearby schools including P.S. 20 Clinton Hill, Compass Charter School, and Trilok School.
Ownership History
Date
Name
Owned For
Owner Type
Purchase Details
Closed on
Jun 27, 2019
Sold by
Ae Oh Pong and Am Oh James
Bought by
258 Dekalb Llc
Current Estimated Value
Home Financials for this Owner
Home Financials are based on the most recent Mortgage that was taken out on this home.
Original Mortgage
$1,072,500
Outstanding Balance
$939,606
Interest Rate
3.82%
Mortgage Type
Purchase Money Mortgage
Estimated Equity
$989,054
Purchase Details
Closed on
Feb 2, 2016
Sold by
Oh James Am and Oh Pong Ae
Bought by
Oh James Am and Oh Pong Ae
Purchase Details
Closed on
Dec 1, 2000
Sold by
Pitch Herbert and Pitch Judi
Bought by
Oh James Am and Oh Pong Ae
Home Financials for this Owner
Home Financials are based on the most recent Mortgage that was taken out on this home.
Original Mortgage
$206,250
Interest Rate
7.14%
Mortgage Type
Commercial
Create a Home Valuation Report for This Property
The Home Valuation Report is an in-depth analysis detailing your home's value as well as a comparison with similar homes in the area
Home Values in the Area
Average Home Value in this Area
Purchase History
| Date | Buyer | Sale Price | Title Company |
|---|---|---|---|
| 258 Dekalb Llc | $1,430,000 | -- | |
| Oh James Am | -- | -- | |
| Oh James Am | $275,000 | -- |
Source: Public Records
Mortgage History
| Date | Status | Borrower | Loan Amount |
|---|---|---|---|
| Open | 258 Dekalb Llc | $1,072,500 | |
| Previous Owner | Oh James Am | $206,250 |
Source: Public Records
Tax History Compared to Growth
Tax History
| Year | Tax Paid | Tax Assessment Tax Assessment Total Assessment is a certain percentage of the fair market value that is determined by local assessors to be the total taxable value of land and additions on the property. | Land | Improvement |
|---|---|---|---|---|
| 2025 | $8,221 | $148,200 | $15,240 | $132,960 |
| 2024 | $8,221 | $143,400 | $15,240 | $128,160 |
| 2023 | $8,142 | $126,720 | $15,240 | $111,480 |
| 2022 | $7,650 | $99,480 | $15,240 | $84,240 |
| 2021 | $7,609 | $90,900 | $15,240 | $75,660 |
| 2020 | $5,707 | $85,380 | $15,240 | $70,140 |
| 2019 | $7,135 | $74,220 | $15,240 | $58,980 |
| 2018 | $6,810 | $33,408 | $8,230 | $25,178 |
| 2017 | $6,510 | $31,936 | $8,432 | $23,504 |
| 2016 | $6,023 | $30,129 | $9,542 | $20,587 |
| 2015 | $3,634 | $28,425 | $10,808 | $17,617 |
| 2014 | $3,634 | $28,425 | $12,962 | $15,463 |
Source: Public Records
Map
Nearby Homes
- 309 Vanderbilt Ave
- 215 Lafayette Ave Unit C
- 330 Clermont Ave
- 291 Clinton Ave
- 177 Lafayette Ave
- 321 Clinton Ave Unit 7
- 286 Dekalb Ave
- 325 Clinton Ave Unit 7G
- 269 Clinton Ave Unit A2
- 269 Clinton Ave Unit A3
- 269 Clinton Ave Unit C1
- 228 Vanderbilt Ave Unit 3 A
- 360 Clinton Ave Unit 6J
- 360 Clinton Ave Unit 5T
- 345-375 Clinton Ave Unit 12 H
- 355 Clinton Ave Unit 9A
- 355 Clinton Ave Unit F1
- 151 Lafayette Ave Unit 1
- 345 Clinton Ave Unit 11A
- 294 Carlton Ave
- 258 Dekalb Ave Unit 1LB
- 258 Dekalb Ave Unit 2
- 256 Dekalb Ave
- 256 Dekalb Ave Unit GARDEN
- 254 Dekalb Ave
- 254 Dekalb Ave Unit 2
- 254 Dekalb Ave Unit PARLORLEV
- 254 Dekalb Ave Unit 3
- 252 Dekalb Ave
- 250 Dekalb Ave
- 250 Dekalb Ave Unit 2
- 250 Dekalb Ave Unit 3
- 297 Vanderbilt Ave
- 292 Clinton Ave
- 292 Clinton Ave Unit 3FL
- 292 Clinton Ave Unit 6
- 260 Dekalb Ave Unit 2
- 294 Clinton Ave
- 299 Vanderbilt Ave
- 299 Vanderbilt Ave