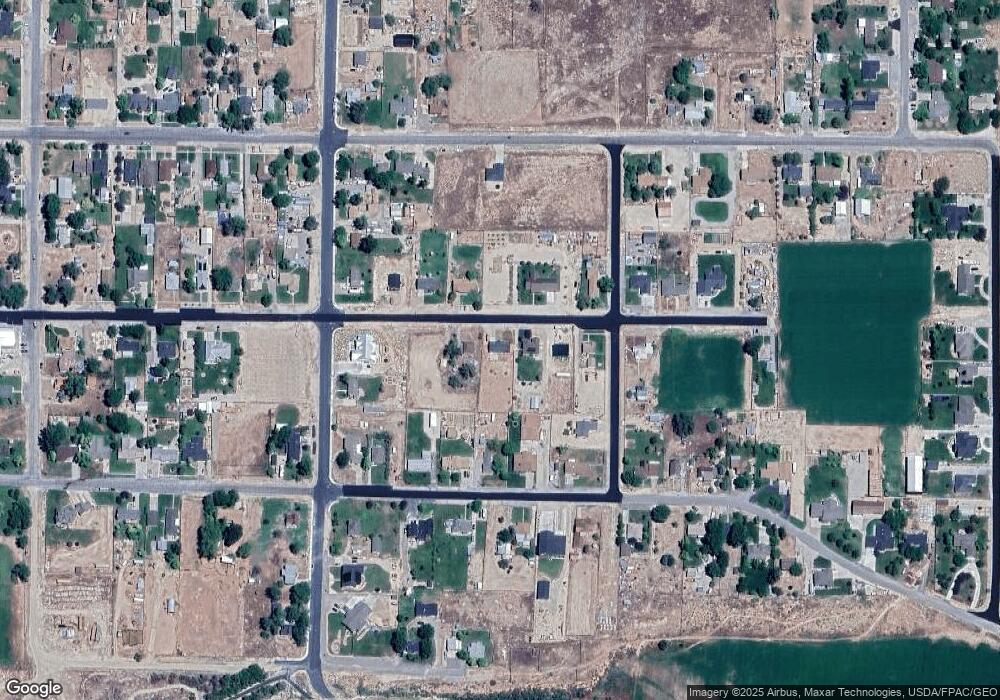
258 E 200 St S Gunnison, UT 84634
Gunnison NeighborhoodEstimated Value: $396,000
4
Beds
2
Baths
2,540
Sq Ft
$156/Sq Ft
Est. Value
About This Home
This home is located at 258 E 200 St S, Gunnison, UT 84634 and is currently estimated at $396,000, approximately $155 per square foot. 258 E 200 St S is a home located in Sanpete County.
Ownership History
Date
Name
Owned For
Owner Type
Purchase Details
Closed on
Sep 16, 2020
Sold by
Caldwell Lance J
Bought by
Henline Connoe
Current Estimated Value
Home Financials for this Owner
Home Financials are based on the most recent Mortgage that was taken out on this home.
Original Mortgage
$232,323
Outstanding Balance
$205,789
Interest Rate
2.8%
Mortgage Type
Construction
Estimated Equity
$190,211
Purchase Details
Closed on
Dec 2, 2008
Sold by
Workman Caleb L
Bought by
Caldwell Lance J
Purchase Details
Closed on
Dec 4, 2006
Sold by
Amelia D Roberson I Ltd
Bought by
Superior Counters & Cultured Marble
Purchase Details
Closed on
Jul 12, 2006
Sold by
Johnson Thomas R and Johnson Robert P
Bought by
Amelia D Roberson I Ltd
Create a Home Valuation Report for This Property
The Home Valuation Report is an in-depth analysis detailing your home's value as well as a comparison with similar homes in the area
Home Values in the Area
Average Home Value in this Area
Purchase History
| Date | Buyer | Sale Price | Title Company |
|---|---|---|---|
| Henline Connoe | $290,403 | Eagle Gate Title Ins Co | |
| Caldwell Lance J | -- | -- | |
| Superior Counters & Cultured Marble | -- | -- | |
| Amelia D Roberson I Ltd | -- | -- |
Source: Public Records
Mortgage History
| Date | Status | Borrower | Loan Amount |
|---|---|---|---|
| Open | Henline Connoe | $232,323 |
Source: Public Records
Tax History Compared to Growth
Tax History
| Year | Tax Paid | Tax Assessment Tax Assessment Total Assessment is a certain percentage of the fair market value that is determined by local assessors to be the total taxable value of land and additions on the property. | Land | Improvement |
|---|---|---|---|---|
| 2024 | $1,913 | $173,328 | $0 | $0 |
| 2023 | $1,717 | $145,186 | $0 | $0 |
| 2022 | $1,660 | $129,631 | $0 | $0 |
| 2021 | $1,569 | $105,995 | $0 | $0 |
| 2020 | $1,466 | $92,882 | $0 | $0 |
| 2019 | $1,397 | $86,336 | $0 | $0 |
| 2018 | $1,448 | $154,568 | $24,640 | $129,928 |
| 2017 | $1,374 | $85,012 | $0 | $0 |
| 2016 | $1,299 | $80,378 | $0 | $0 |
| 2015 | $1,301 | $80,378 | $0 | $0 |
| 2014 | $1,280 | $80,378 | $0 | $0 |
| 2013 | $1,304 | $82,110 | $0 | $0 |
Source: Public Records
Map
Nearby Homes
